Fig. 2
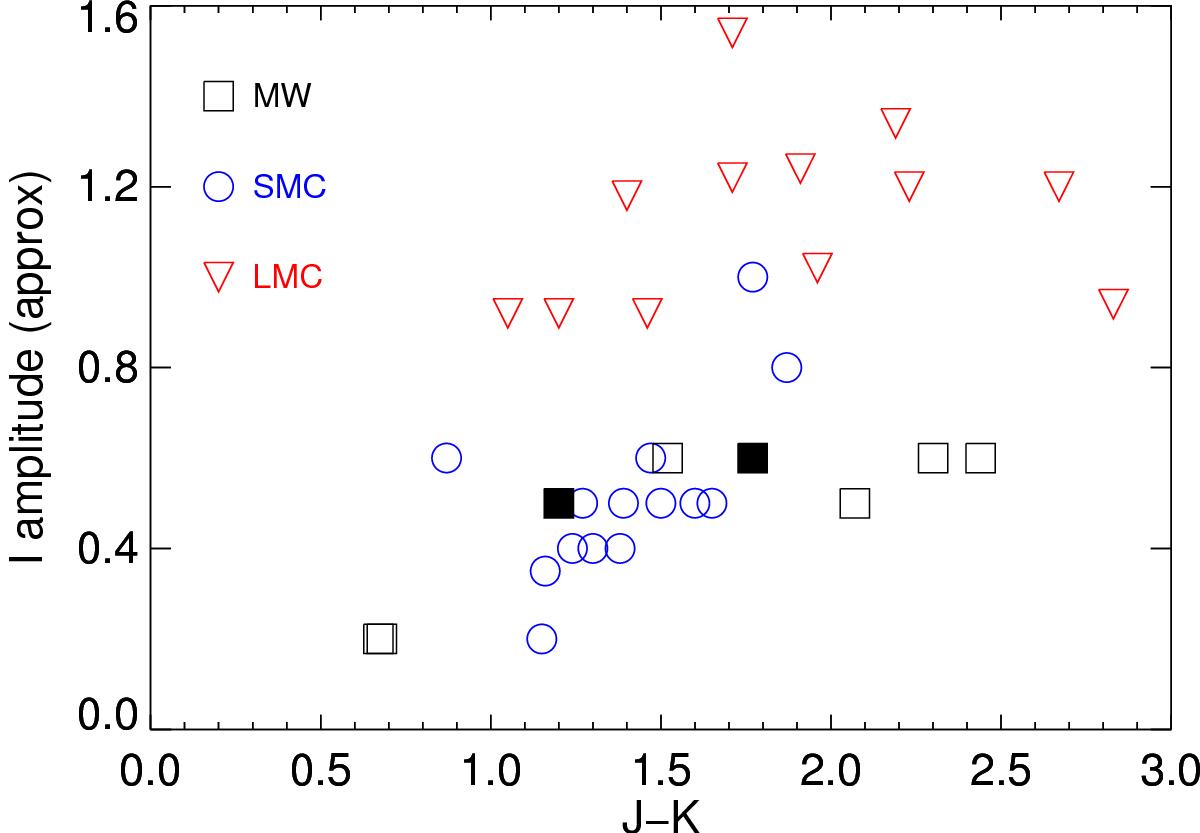
I-band amplitudes of our sample stars. Symbols are as in Fig. 1. The amplitudes are estimated peak-to-peak variations. The values for LMC stars are taken from Hughes & Wood (1990). For the SMC stars, we estimated amplitudes using OGLE light curves (available through the Vizier service at CDS). For the MW, we estimated amplitudes based on K-band amplitudes by Whitelock et al. (2006); a value of 0.5 was assigned when no data were available. We note that for two MW stars (filled squares) large-amplitude luminosity dips are known to occur occasionally in addition to small-amplitude variations (the R CrB phenomenon).
Current usage metrics show cumulative count of Article Views (full-text article views including HTML views, PDF and ePub downloads, according to the available data) and Abstracts Views on Vision4Press platform.
Data correspond to usage on the plateform after 2015. The current usage metrics is available 48-96 hours after online publication and is updated daily on week days.
Initial download of the metrics may take a while.