Free Access
Fig. A.1
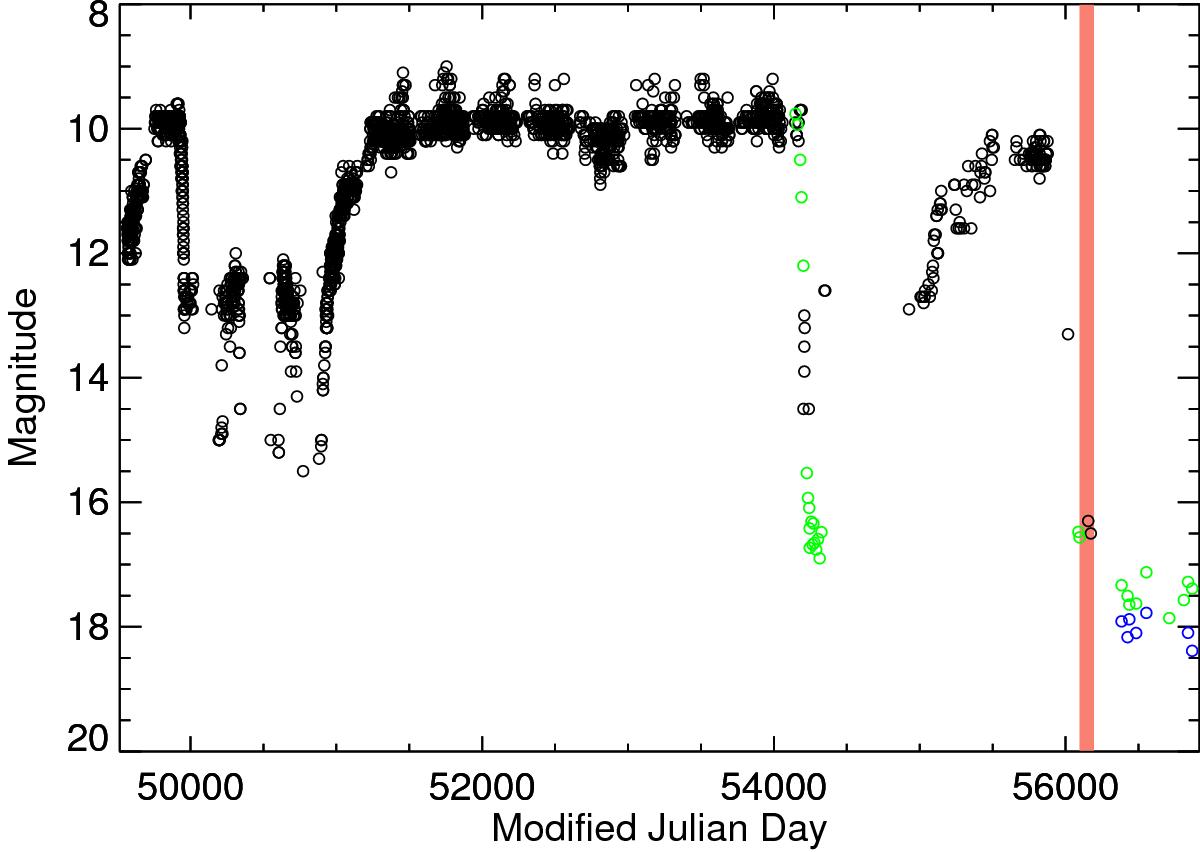
Light curve of V CrA, based on AAVSO data. The time range is from 01/08/1994 to 29/07/2014. Our observing time is highlighted by the red marker and is clearly during a drop in brightness of the star. The black circles stand for the Vis bandpass, the green points for the V bandpass and the blue points for the B bandpass.
Current usage metrics show cumulative count of Article Views (full-text article views including HTML views, PDF and ePub downloads, according to the available data) and Abstracts Views on Vision4Press platform.
Data correspond to usage on the plateform after 2015. The current usage metrics is available 48-96 hours after online publication and is updated daily on week days.
Initial download of the metrics may take a while.