Free Access
Fig. 14
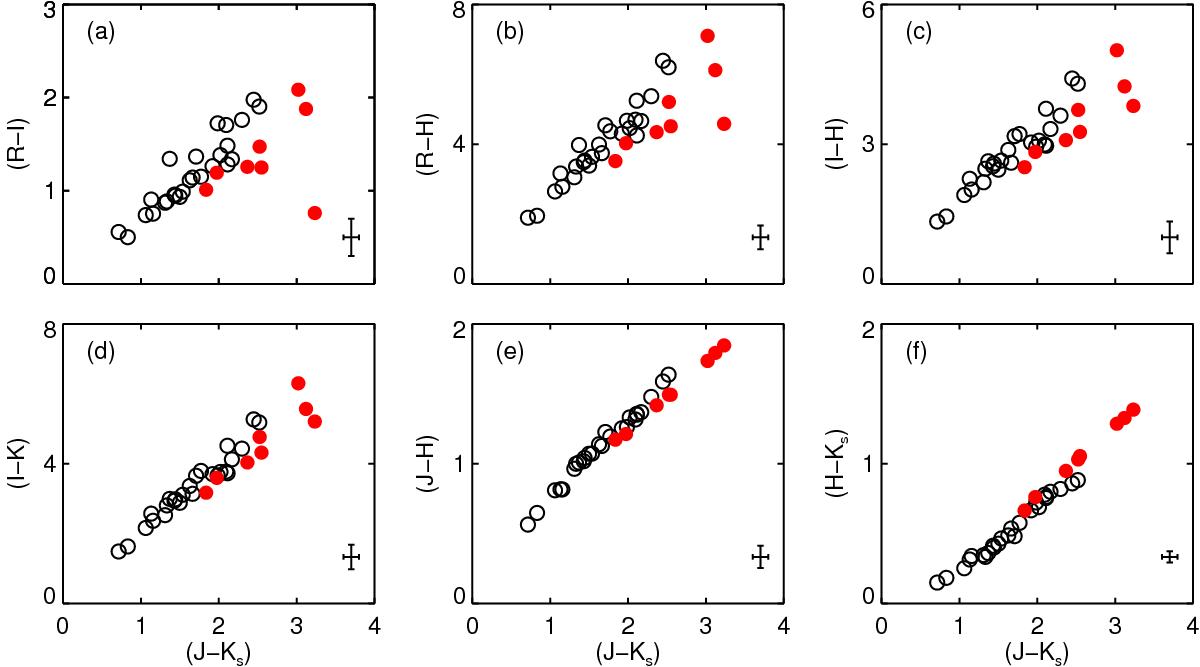
Some color–color plots derived from our sample of carbon stars. The red circles stand for carbon stars showing the 1.53 μm feature. For the R filter, we adopt some conservative values. The bars plotted in the bottom-right corners are determined as in Fig. 6.
Current usage metrics show cumulative count of Article Views (full-text article views including HTML views, PDF and ePub downloads, according to the available data) and Abstracts Views on Vision4Press platform.
Data correspond to usage on the plateform after 2015. The current usage metrics is available 48-96 hours after online publication and is updated daily on week days.
Initial download of the metrics may take a while.