Free Access
Fig. 13
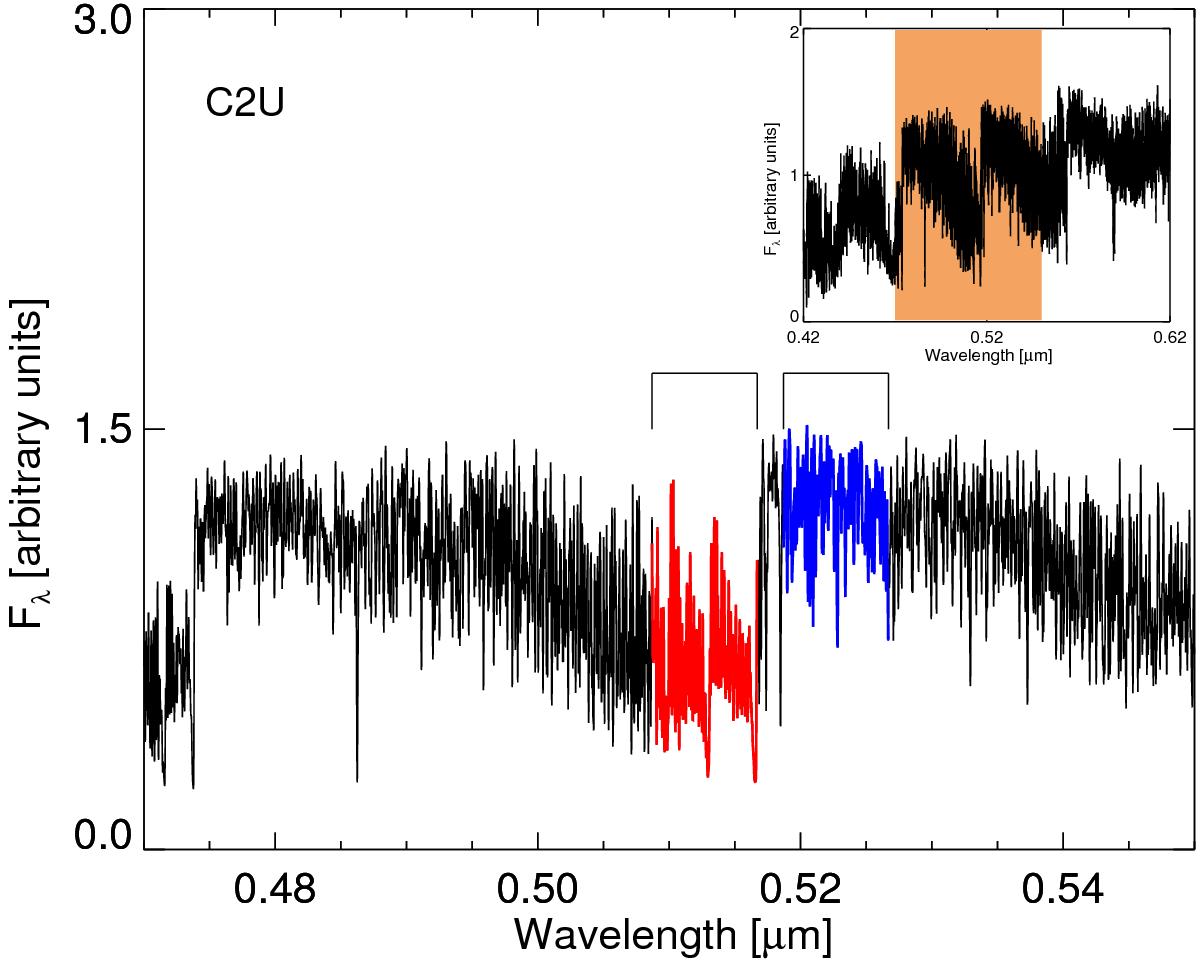
The C2 Swan system (top panel) and a zoom into the C2 line around 0.5165 μm. The red line indicates the region used to calculate the C2U_band bandpass, while the blue line corresponds to the C2U_cont bandpass measuring the continuum. This star is HE 1428-1950.
Current usage metrics show cumulative count of Article Views (full-text article views including HTML views, PDF and ePub downloads, according to the available data) and Abstracts Views on Vision4Press platform.
Data correspond to usage on the plateform after 2015. The current usage metrics is available 48-96 hours after online publication and is updated daily on week days.
Initial download of the metrics may take a while.