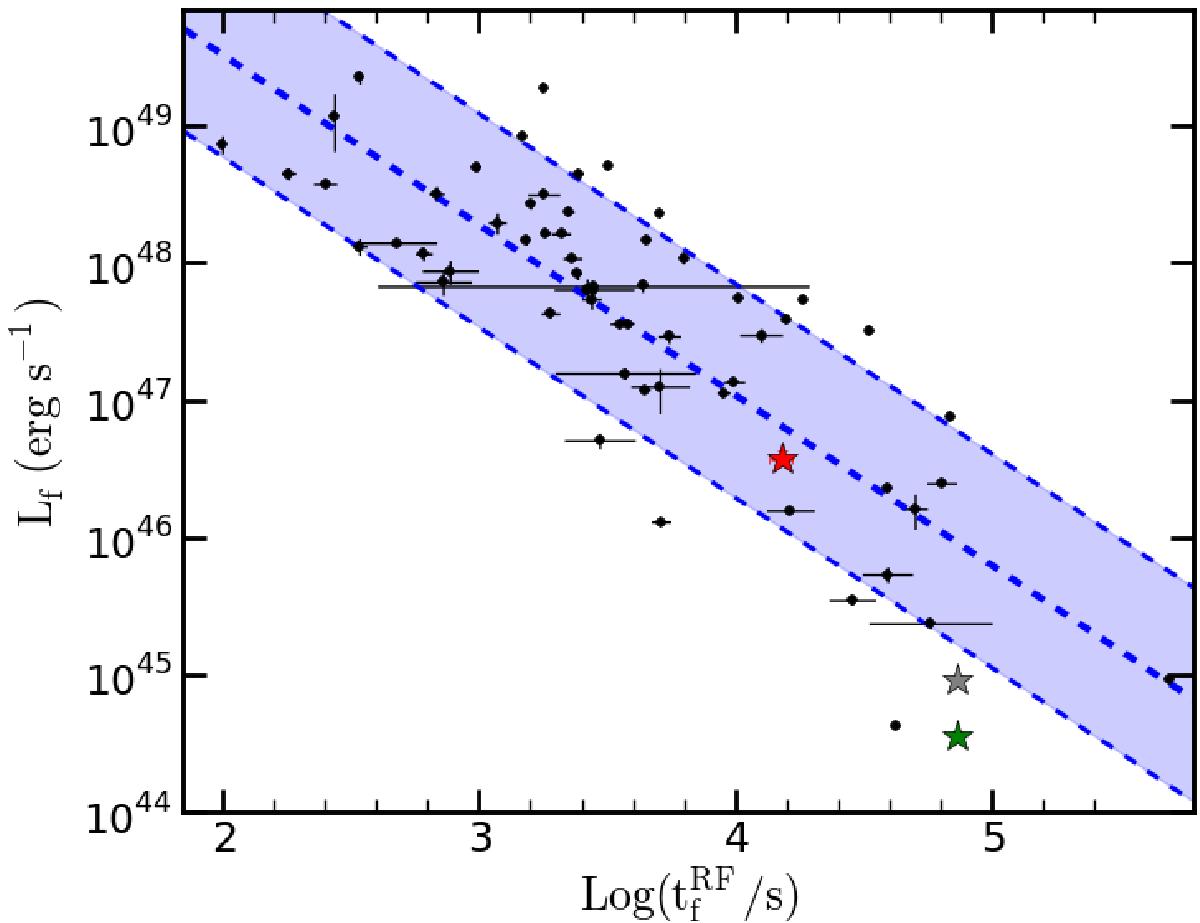
Fig. 5

0.3−30 keV luminosity at the end of the energy-injection phase (Dainotti et al. 2008). The black dots are taken from Margutti et al. (2013). The stars correspond to the GRB 121024A afterglow: the red star to when the end of the plateau phase lies at 49.8 ks, the green star corresponds to the ongoing energy-injection phase before and after the break in the LC at t = 240 ks, and the grey star corresponds to the luminosity corrected for the jet-break effect. The dashed line in the middle corresponds to the best fit, and the shaded region is the 1σ error of the fit.
Current usage metrics show cumulative count of Article Views (full-text article views including HTML views, PDF and ePub downloads, according to the available data) and Abstracts Views on Vision4Press platform.
Data correspond to usage on the plateform after 2015. The current usage metrics is available 48-96 hours after online publication and is updated daily on week days.
Initial download of the metrics may take a while.


