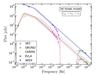
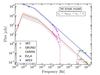
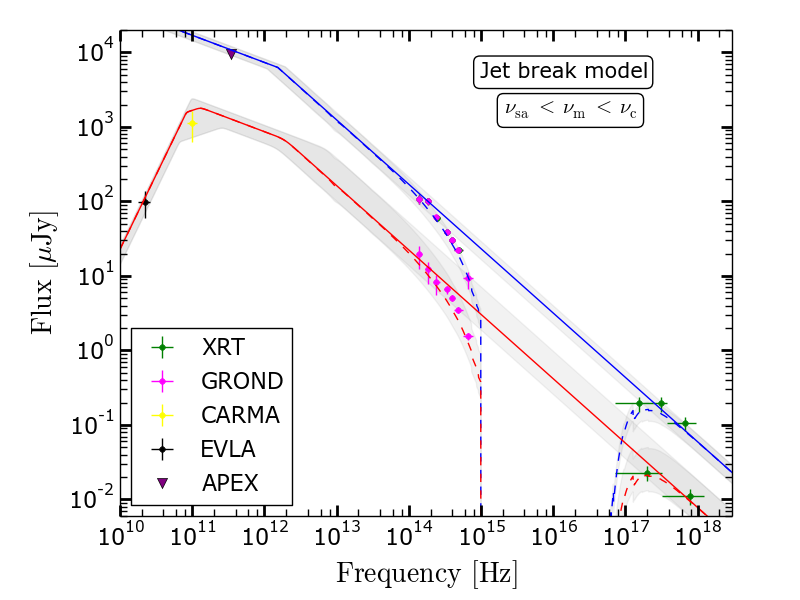
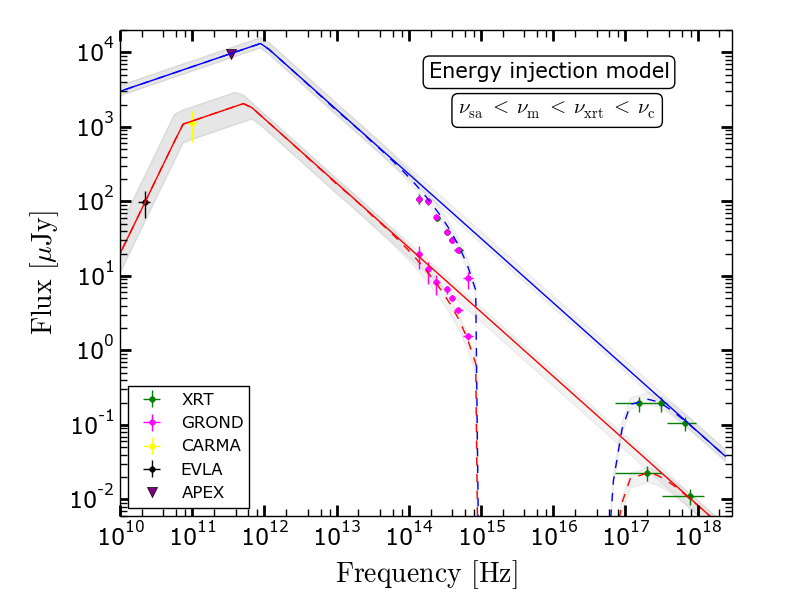
Fig. 4
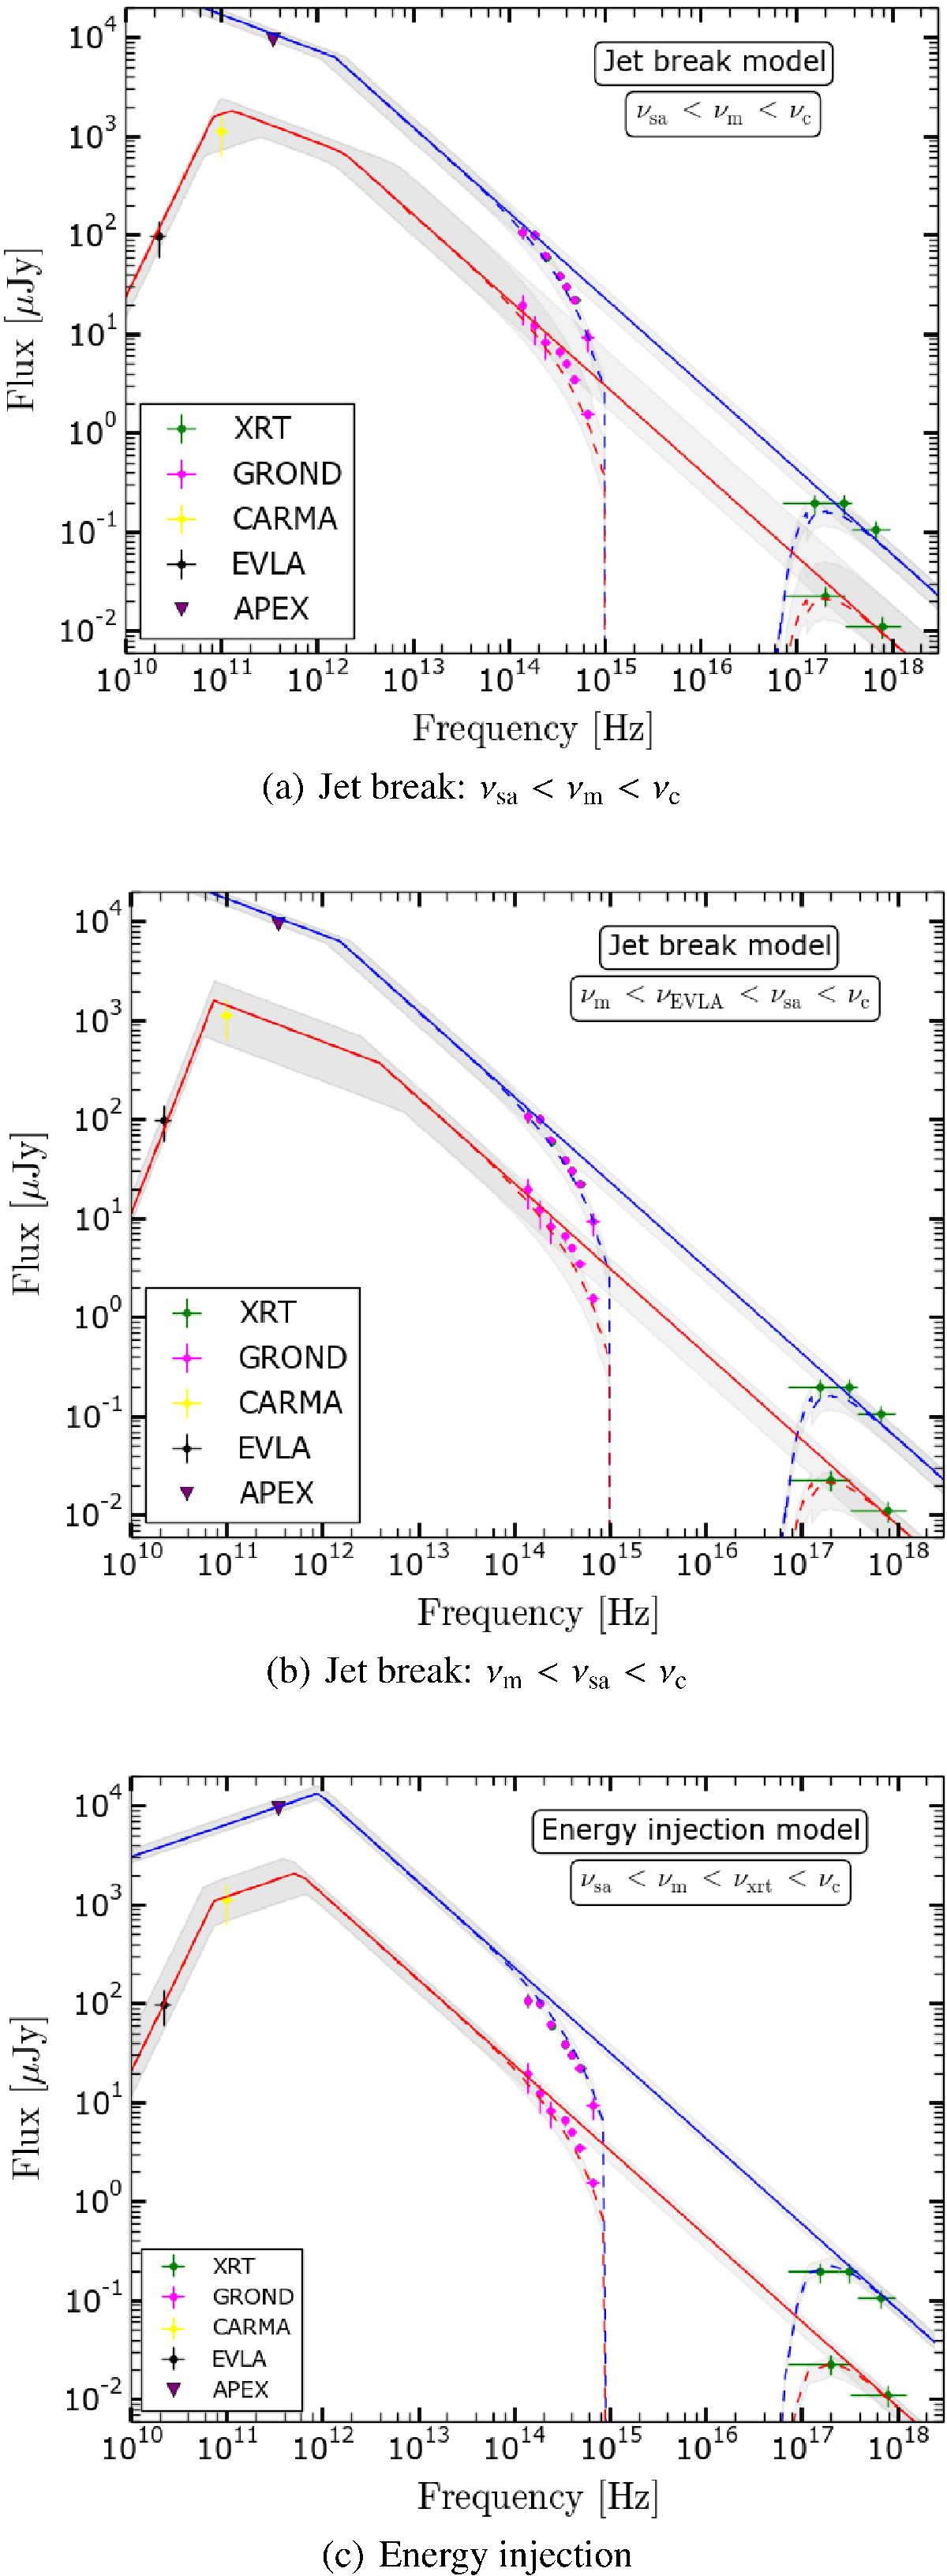
Broadband SEDs of the afterglow of GRB 121024A from the radio to the X-ray regime for the three models described in Sect. 4. Blue line: SED at t = 21.9 ks. Red line: SED at t = 109.0 ks. The dashed lines represent the absorbed model, the solid lines the unabsorbed model. The grey-shaded regions corresponds to the 1σ limits of the model.
Current usage metrics show cumulative count of Article Views (full-text article views including HTML views, PDF and ePub downloads, according to the available data) and Abstracts Views on Vision4Press platform.
Data correspond to usage on the plateform after 2015. The current usage metrics is available 48-96 hours after online publication and is updated daily on week days.
Initial download of the metrics may take a while.