Fig. 3
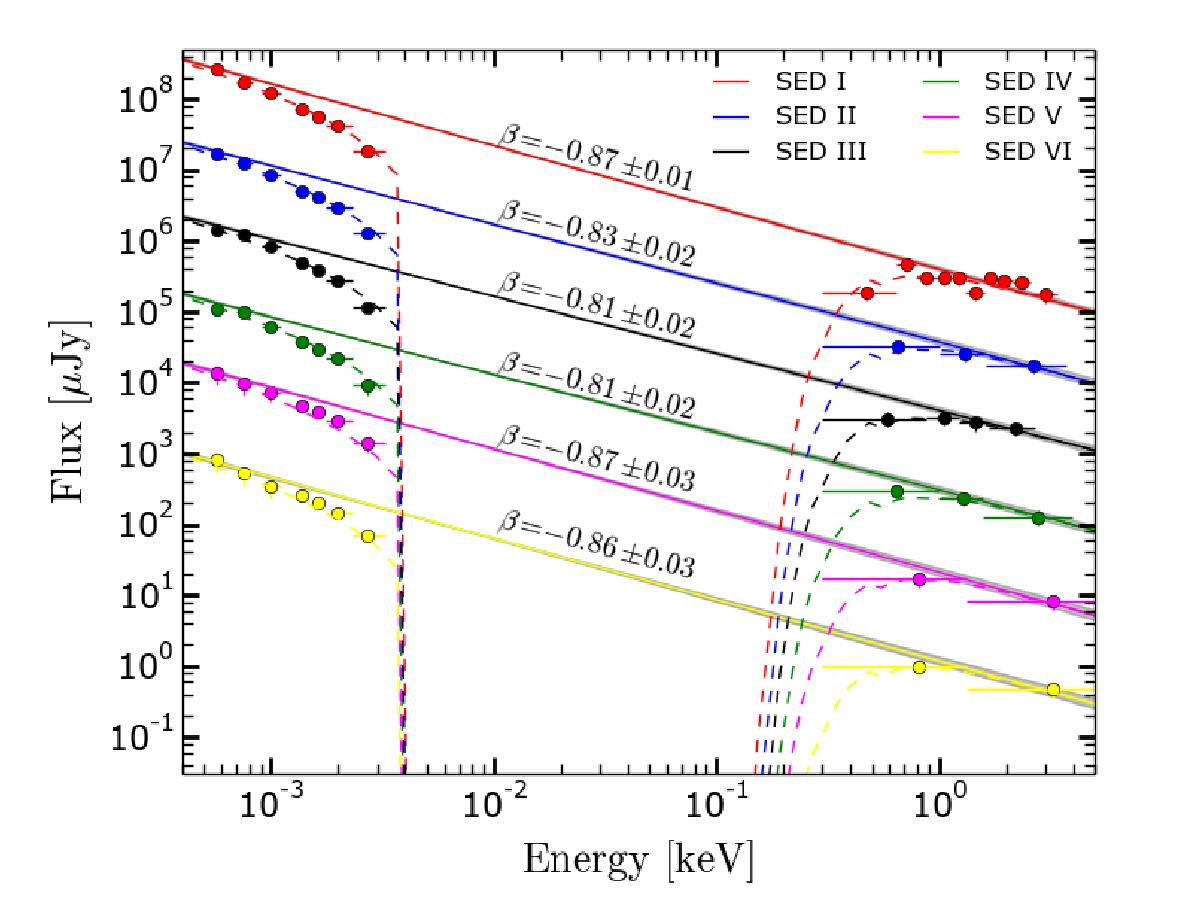
Spectral energy distribution for the six SEDs highlighted in Fig. 2. SEDs I – IV are from data before the observed break in the light curve. SEDs V and VI are from data taken after the break. The SEDs are scaled with an arbitrary factor for clarity in the plot. The values of β written above each line corresponds to the single power-law fit, where the slopes were left free to vary. The single power-law fit with a single tied slope has β = 0.86 ± 0.02.
Current usage metrics show cumulative count of Article Views (full-text article views including HTML views, PDF and ePub downloads, according to the available data) and Abstracts Views on Vision4Press platform.
Data correspond to usage on the plateform after 2015. The current usage metrics is available 48-96 hours after online publication and is updated daily on week days.
Initial download of the metrics may take a while.