Fig. 2
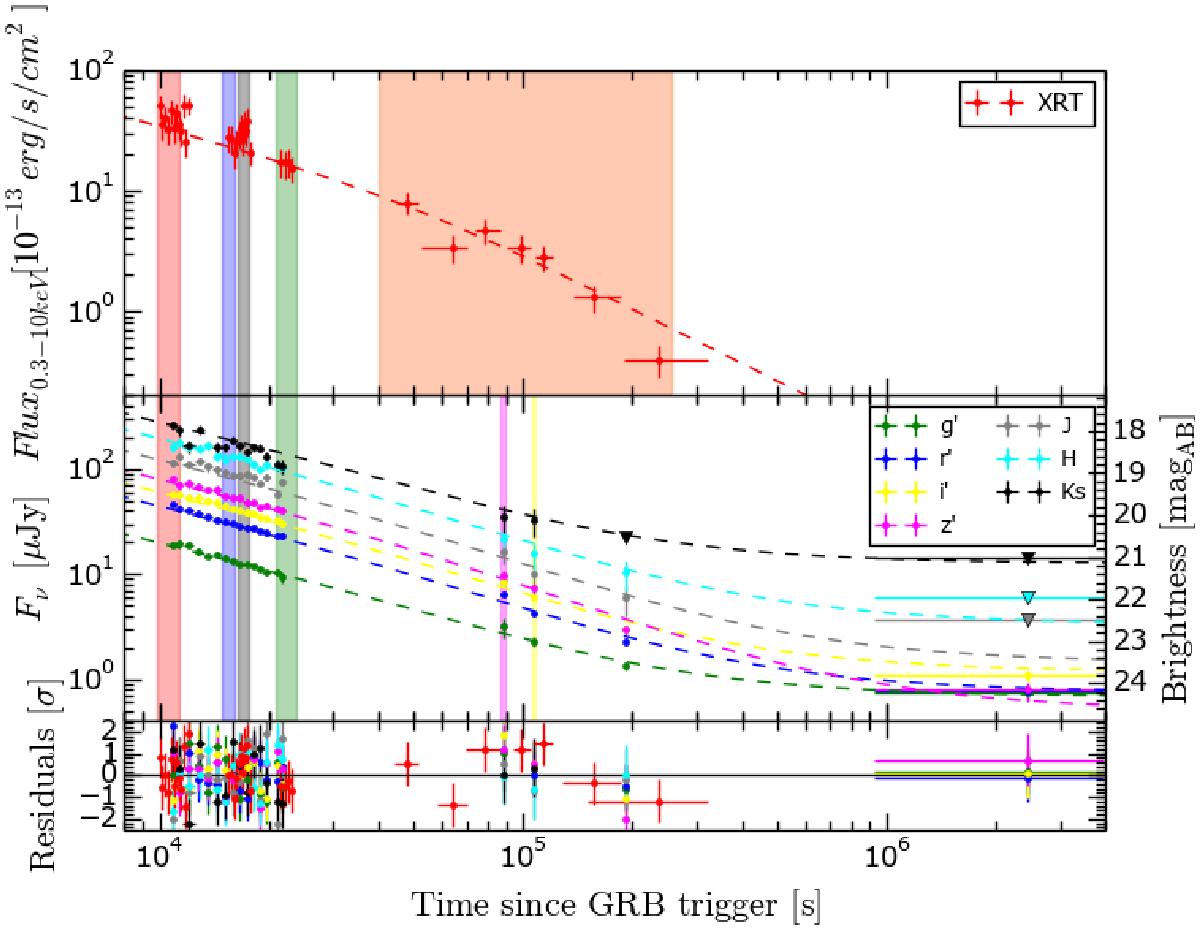
Light curve of the afterglow of GRB 121024A. Top: XRT light curve from the XRT repository. Bottom: GROND light curve in g′r′i′z′JHKs. The best fit for the combined light curve (optical/NIR and X-ray data) is a smoothly broken power law with host contribution, shown with dashed lines. The epochs used for the spectral analysis are highlighted with the vertical bars. The break time tb = 49.8 ± 5.1 ks.
Current usage metrics show cumulative count of Article Views (full-text article views including HTML views, PDF and ePub downloads, according to the available data) and Abstracts Views on Vision4Press platform.
Data correspond to usage on the plateform after 2015. The current usage metrics is available 48-96 hours after online publication and is updated daily on week days.
Initial download of the metrics may take a while.