Free Access
Fig. 3
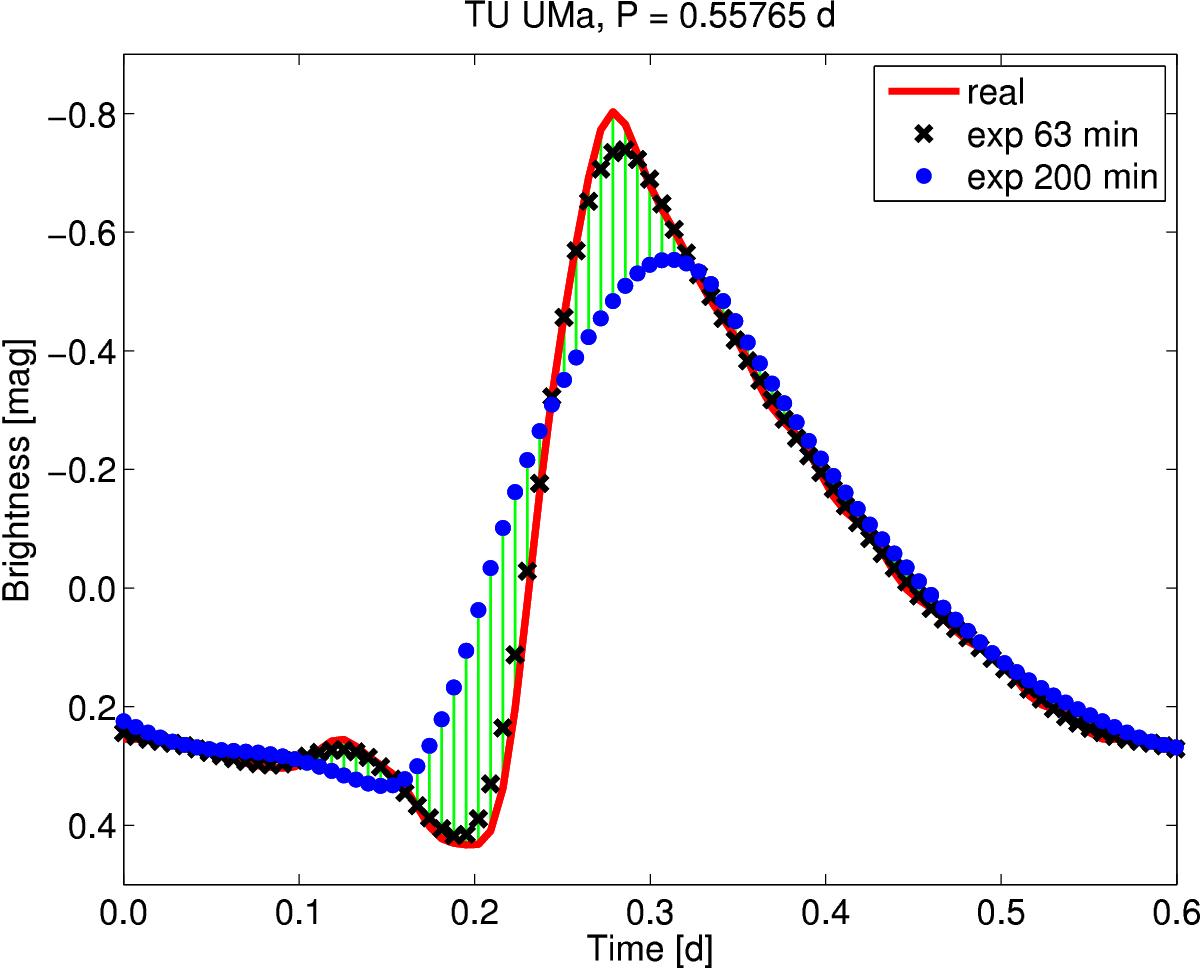
Change of the light curve shape caused by long exposure time. The model of the real light curve based on B-band observations from Liakos & Niarchos (2011a; red line) is plotted together with models of observed curves with exposures of 63 min (black crosses) and 200 min (blue dots).
Current usage metrics show cumulative count of Article Views (full-text article views including HTML views, PDF and ePub downloads, according to the available data) and Abstracts Views on Vision4Press platform.
Data correspond to usage on the plateform after 2015. The current usage metrics is available 48-96 hours after online publication and is updated daily on week days.
Initial download of the metrics may take a while.