Fig. 9
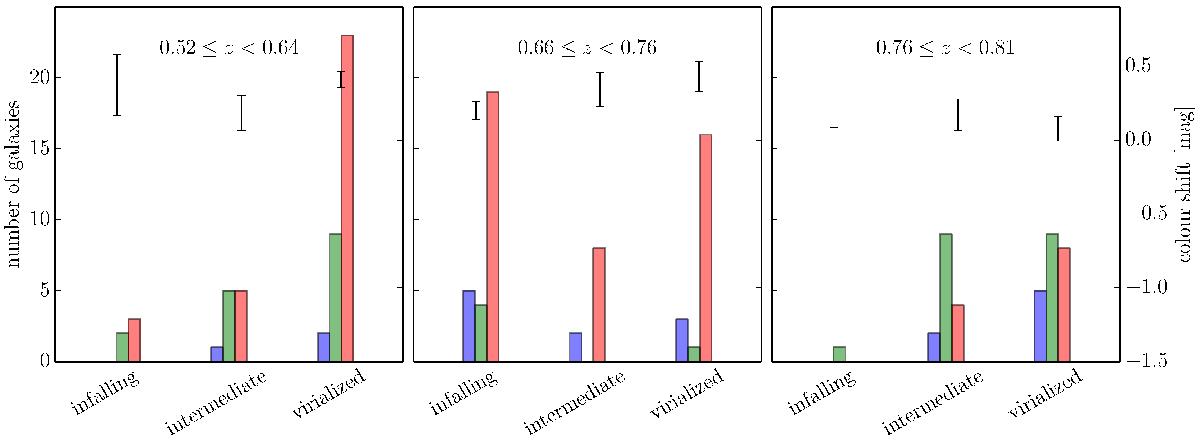
Same as Figs. 7 and 8, but with the clusters binned in redshift. The mean colour shift, δ(V−I), between the field disc colours and the cluster disc colours is given for each galaxy type and for each redshift bin. The scale of these shifts is provided on the right-hand vertical axis. The error bars correspond to the dispersion around this mean value.
Current usage metrics show cumulative count of Article Views (full-text article views including HTML views, PDF and ePub downloads, according to the available data) and Abstracts Views on Vision4Press platform.
Data correspond to usage on the plateform after 2015. The current usage metrics is available 48-96 hours after online publication and is updated daily on week days.
Initial download of the metrics may take a while.