Fig. 5
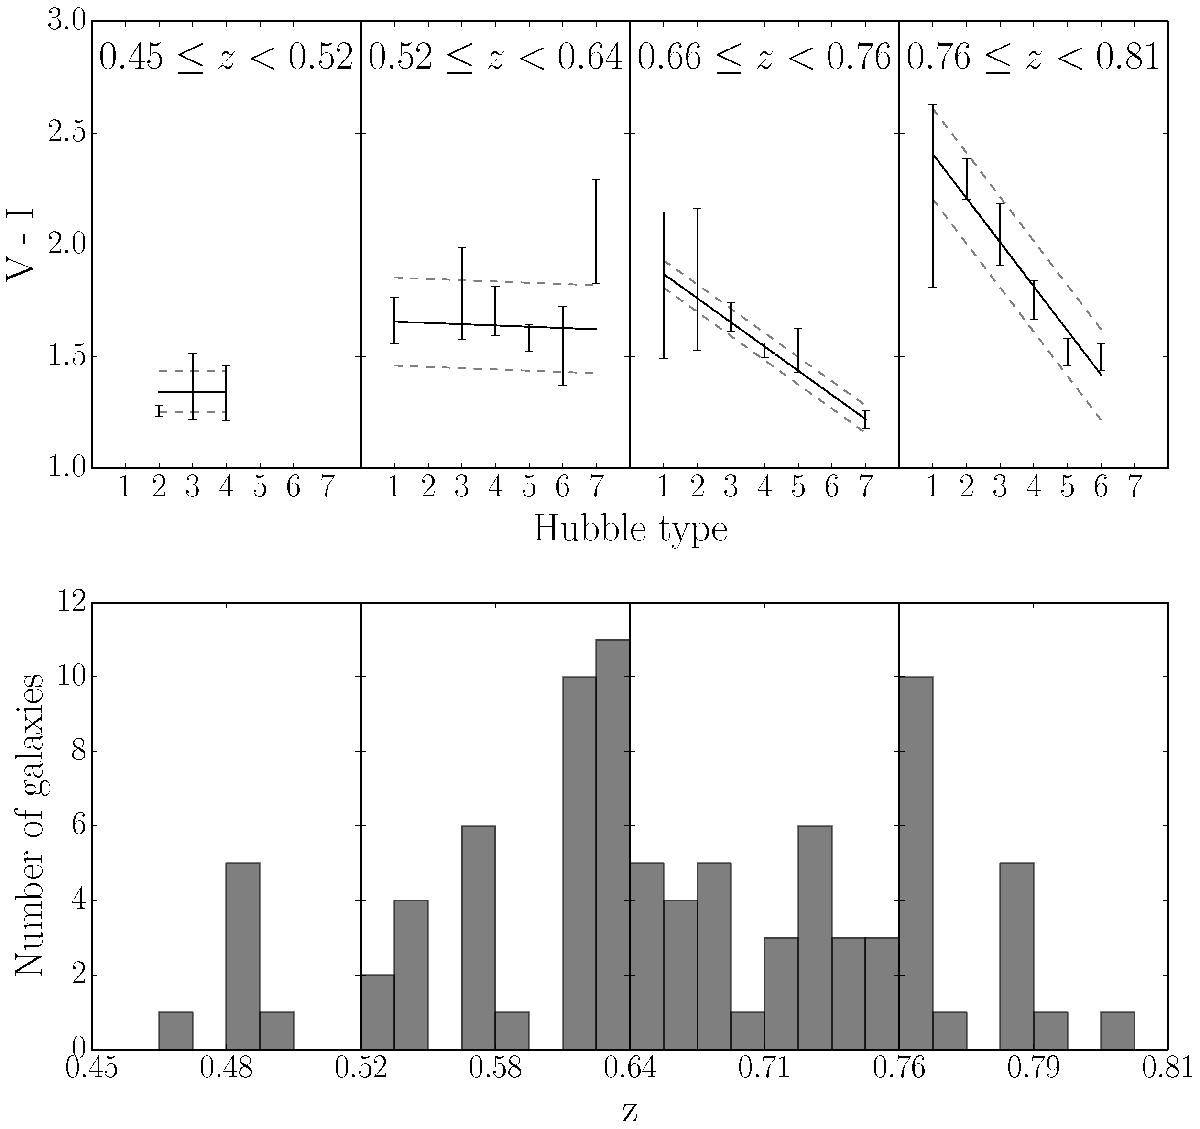
Colour-morphology relation for the discs of field galaxies at different redshifts. In each of the upper panels the solid lines show the best fit of the relation that is obtained by keeping both the slope and the y-intercept as free parameters. The dashed lines show the 1σ confidence interval, computed from the covariance matrix of the fits. These fits are used to infer the relative colour properties of field and cluster discs. The lower panel shows the redshift distribution of the galaxies inside each redshift bin.
Current usage metrics show cumulative count of Article Views (full-text article views including HTML views, PDF and ePub downloads, according to the available data) and Abstracts Views on Vision4Press platform.
Data correspond to usage on the plateform after 2015. The current usage metrics is available 48-96 hours after online publication and is updated daily on week days.
Initial download of the metrics may take a while.