Fig. 4
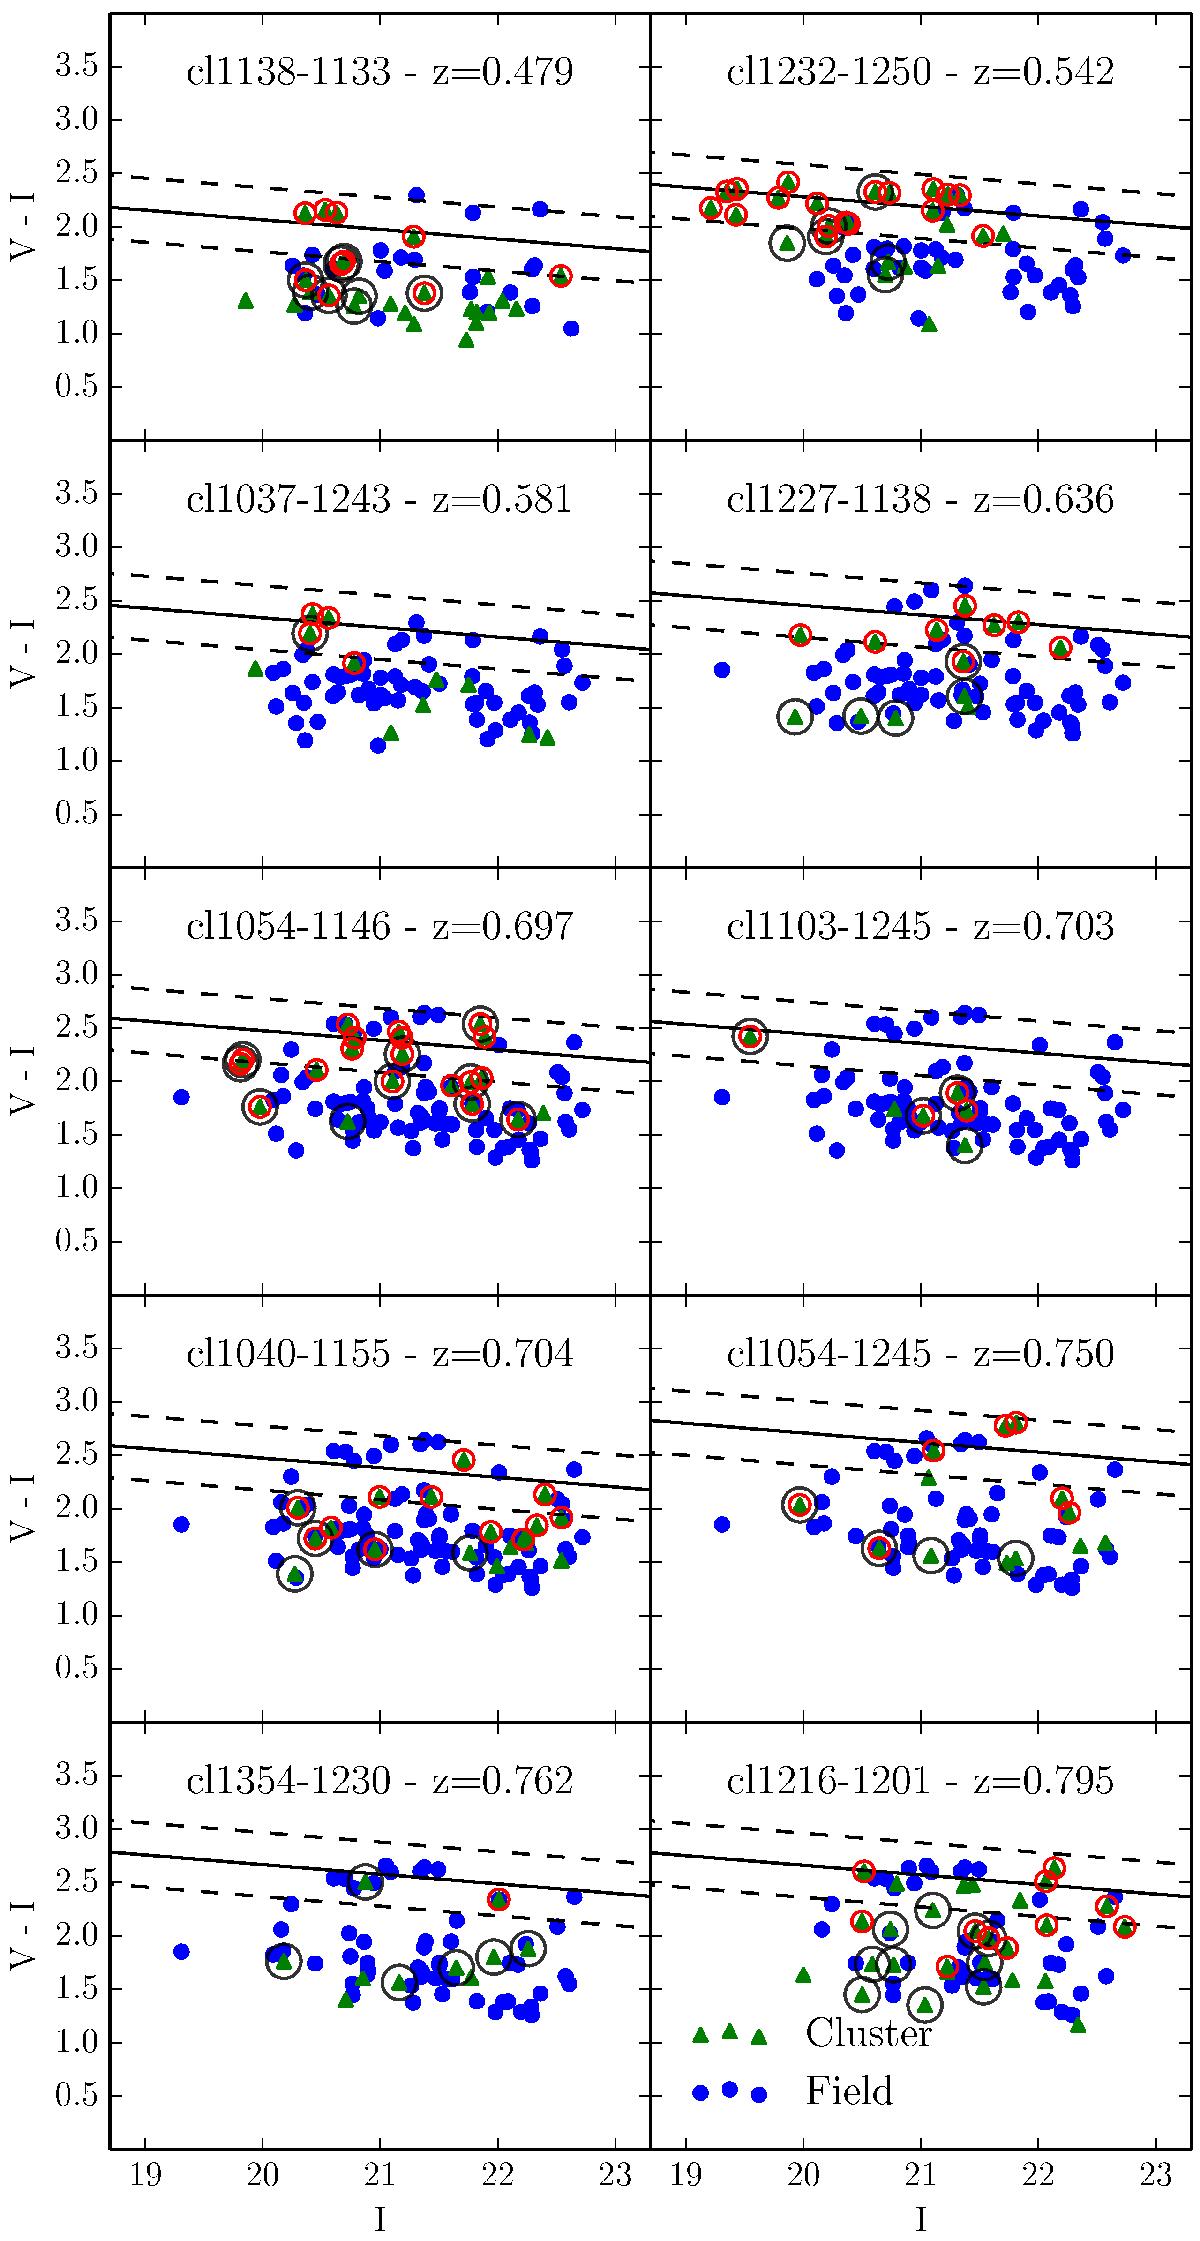
Colour−magnitude diagrams of the spiral galaxies in the ten EDisCS clusters. In each panel, the green triangles indicate the cluster members. The blue points are the field galaxies within ± 0.03 the cluster redshift with or without HST imaging (see Sect. 2). The solid thick lines represent the red sequence best-fit relations, using all the cluster members and a bi-weight estimator (Beers et al. 1990), and assuming a fixed slope of α = −0.09 as in De Lucia et al. (2007). The dashed lines correspond to a ± 0.3 mag deviation from this best-fit line. The red circles identify galaxies with discs redder than their field counterparts, i.e., at same redshift and with same morphological type, as identified in Fig. 6. The black circles show the galaxies that were detected at 24 μm with Spitzer.
Current usage metrics show cumulative count of Article Views (full-text article views including HTML views, PDF and ePub downloads, according to the available data) and Abstracts Views on Vision4Press platform.
Data correspond to usage on the plateform after 2015. The current usage metrics is available 48-96 hours after online publication and is updated daily on week days.
Initial download of the metrics may take a while.