Fig. 3
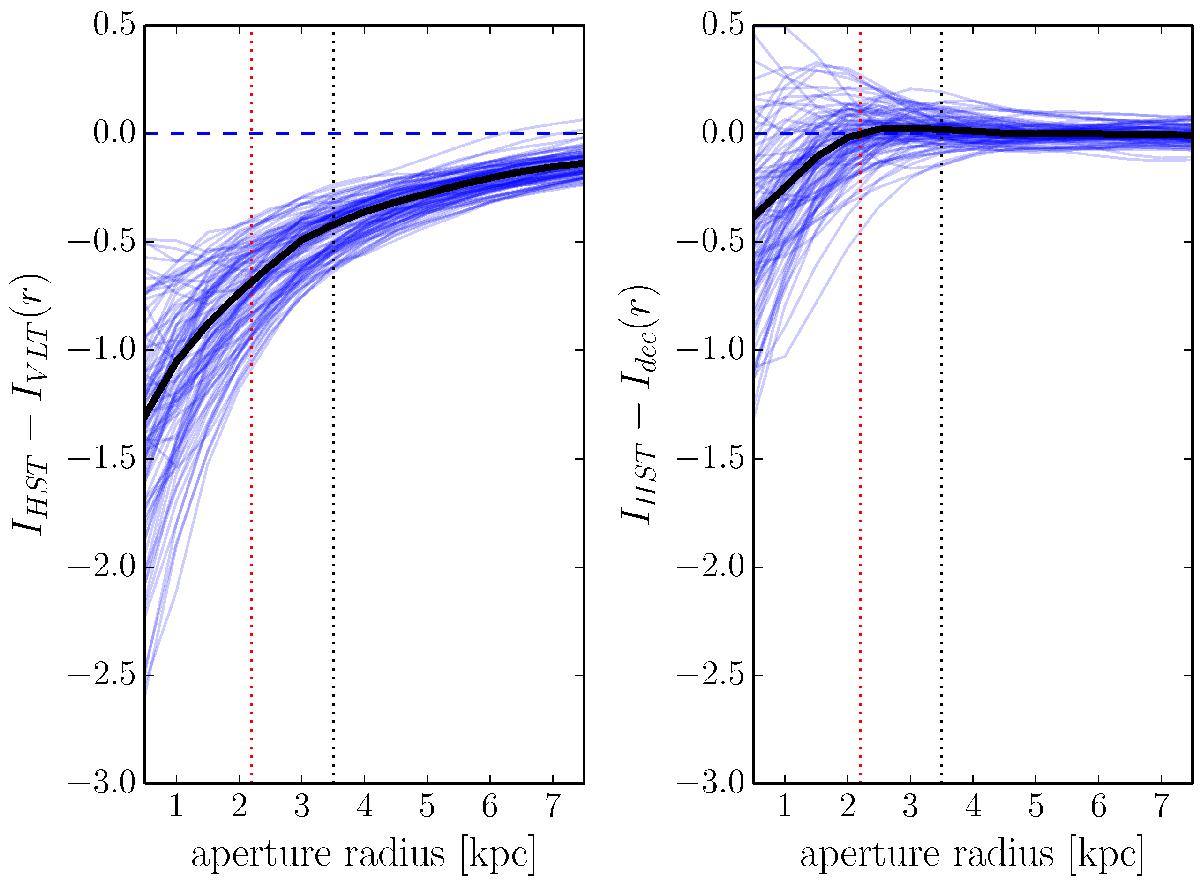
Left: differences between the aperture photometry performed on images obtained with the ACS at the HST and on the original FORS2 images. Right: the difference between the aperture photometry performed on the deconvolved FORS2 and the images of the ACS at the HST. Ninety percent of the ACS PSF energy is contained inside a 2.2 kpc radius, shown as the dotted red line. The measurements made on the HST and the VLT-deconvolved images down to 3.5 kpc from the centre of the galaxy (black dotted line) agree excellently well.
Current usage metrics show cumulative count of Article Views (full-text article views including HTML views, PDF and ePub downloads, according to the available data) and Abstracts Views on Vision4Press platform.
Data correspond to usage on the plateform after 2015. The current usage metrics is available 48-96 hours after online publication and is updated daily on week days.
Initial download of the metrics may take a while.