Fig. 2
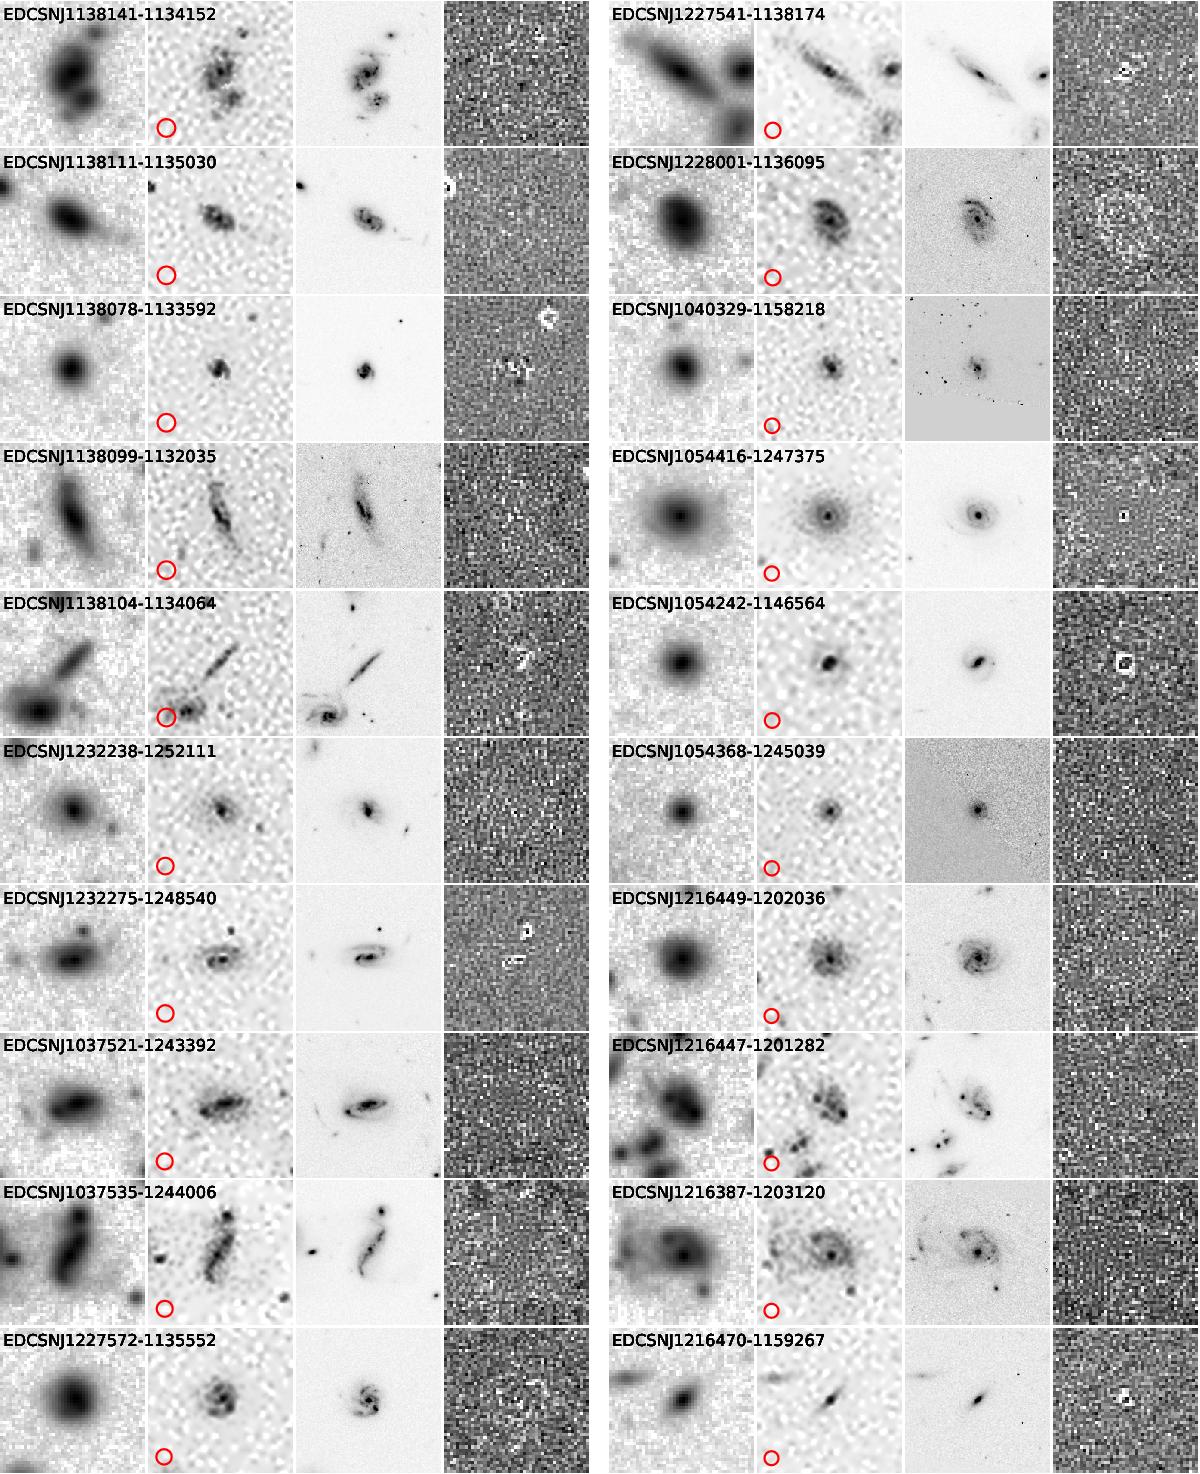
Examples of deconvolving the EDisCS spiral galaxies over the whole redshift range. From left to right, the columns show (i) the original I-band images obtained with FORS2 at the VLT with seeing between 0.5′′ and 0.7′′; (ii) their corresponding deconvolved VLT images with a resolution of 0.1′′; (iii) the images obtained with the ACS at the HST in the F814W filter for comparison; and (iv) the residual images in units of the photon noise between the initial FORS2 images and their deconvolution. The red circles represent the 3.5 kpc circular aperture used to remove the bulge contribution. The similarities between the VLT deconvolutions and the HST images are striking: details such as spiral arms or dust lanes previously smeared out by the PSF are made visible and are confirmed by the HST images.
Current usage metrics show cumulative count of Article Views (full-text article views including HTML views, PDF and ePub downloads, according to the available data) and Abstracts Views on Vision4Press platform.
Data correspond to usage on the plateform after 2015. The current usage metrics is available 48-96 hours after online publication and is updated daily on week days.
Initial download of the metrics may take a while.