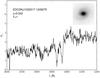
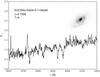
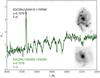
Fig. 11
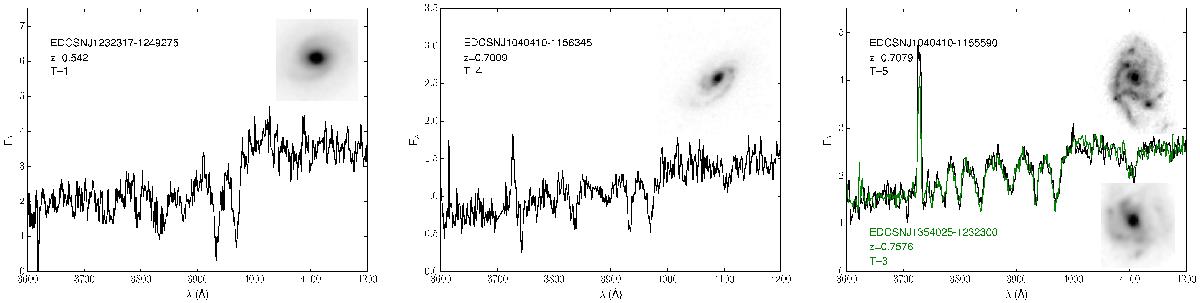
Three examples of FORS2 spectra. The name of the galaxy, redshift, and T-type are indicated. The left panel displays a representative spectrum of a galaxy on the red sequence, whose disc is redder than its field counterparts. The middle panel shows the spectrum of a galaxy in the blue sequence, but forming stars at a low rate and with a red disc. The right panel displays in black the spectrum of a galaxy that actively forms stars, but with redder disc than its field counterparts. For comparison we show in green a galaxy with a field-like disc that exhibits the same spectral feature and colours as the galaxy in black, but with an earlier morphological T-type.
Current usage metrics show cumulative count of Article Views (full-text article views including HTML views, PDF and ePub downloads, according to the available data) and Abstracts Views on Vision4Press platform.
Data correspond to usage on the plateform after 2015. The current usage metrics is available 48-96 hours after online publication and is updated daily on week days.
Initial download of the metrics may take a while.