Fig. 10
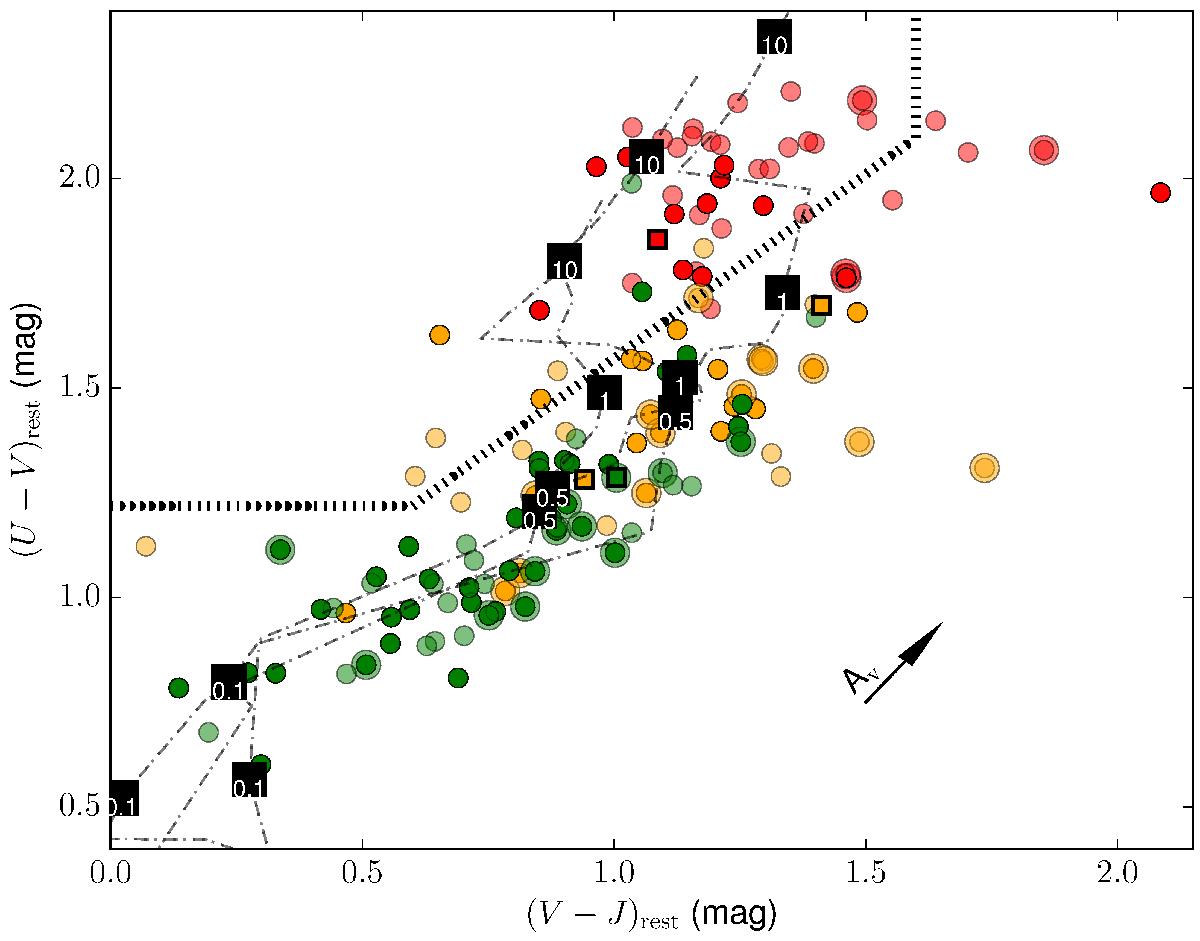
Rest frame U−V versus V−J diagram. Galaxies with disc colours compatible with their field counterparts are shown in green. Galaxies that are still forming stars, but whose discs are nonetheless redder than their field counterparts, are plotted in orange. Galaxies with red discs that are on the red sequence are shown in red. Large circles identify galaxies that have been detected at 24 μm with Spitzer and have log LIR ≥ 10.91 (SFR ~ 14 M⊙/yr. Plain colours identify face-on galaxies. The three squares correspond to the three galaxies in Fig. 11. The models of Maraston (1998) and Maraston et al. (2003) are shown as dot-dashed lines, and a few ages of the single stellar population are indicated.
Current usage metrics show cumulative count of Article Views (full-text article views including HTML views, PDF and ePub downloads, according to the available data) and Abstracts Views on Vision4Press platform.
Data correspond to usage on the plateform after 2015. The current usage metrics is available 48-96 hours after online publication and is updated daily on week days.
Initial download of the metrics may take a while.