Free Access
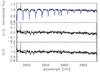
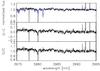
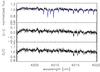
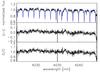
Fig. 1

Example spectrum of HD 209458 for the 4010 nm setting of CRIRES, showing all four detectors. Upper panel: CRIRES spectrum (black) and synthetic telluric spectrum (blue) from the telluric modeling. Lower panels: observed-computed (O–C) residuals and observed/computed (O/C) results. The O/C spectra are used in the analysis.
This figure is made of several images, please see below:
Current usage metrics show cumulative count of Article Views (full-text article views including HTML views, PDF and ePub downloads, according to the available data) and Abstracts Views on Vision4Press platform.
Data correspond to usage on the plateform after 2015. The current usage metrics is available 48-96 hours after online publication and is updated daily on week days.
Initial download of the metrics may take a while.