Fig. 10
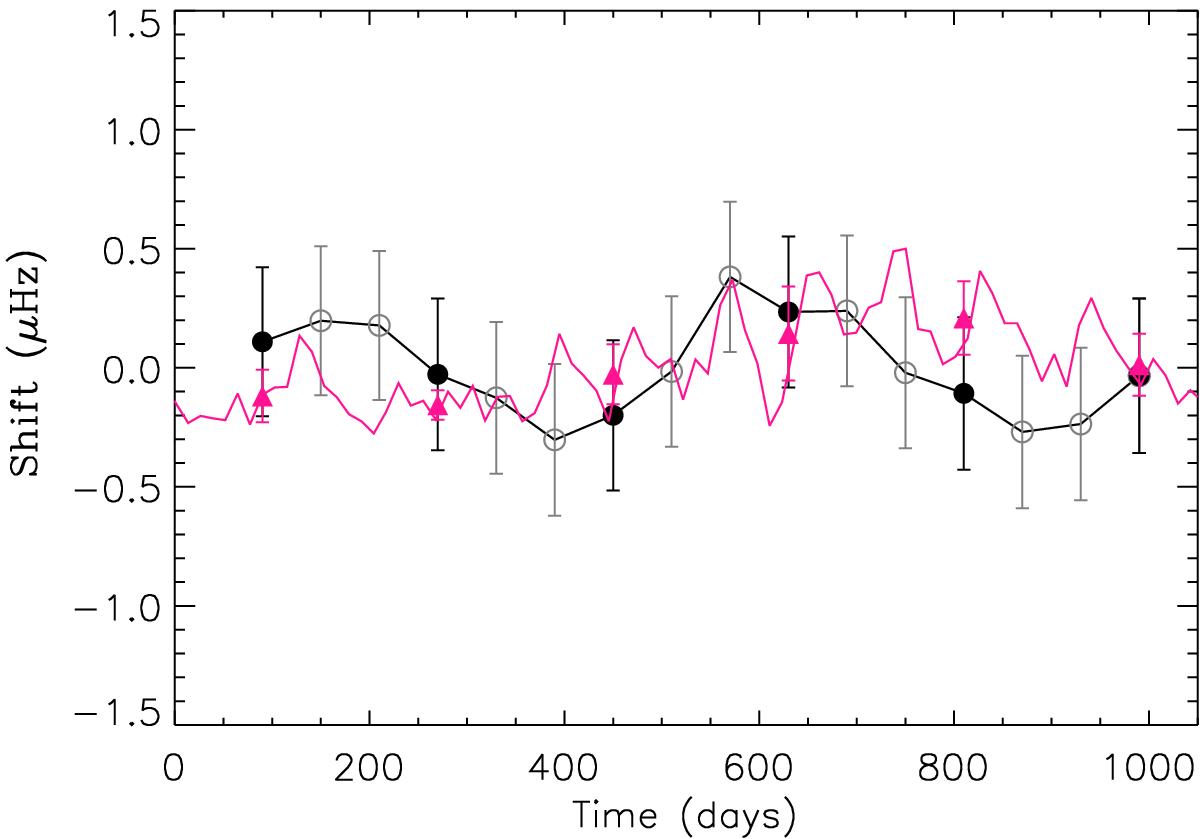
Frequency shifts of KIC 3733735 calculated using 180-day subseries shifted every 60 days.The points obtained from independent spectra are shown as full black circles. The power spectrum is centred at a νmax = 1950 μHz with a range of ±300 μHz and a smoothing of 31 points. The mean spectra used as the reference for the cross-correlation are generated with independent spectra. The pink curve is the Sph computed by Mathur et al. (2014a). The pink triangles are the integration of the Sph to the same 180-d ranges as the frequency shifts.
Current usage metrics show cumulative count of Article Views (full-text article views including HTML views, PDF and ePub downloads, according to the available data) and Abstracts Views on Vision4Press platform.
Data correspond to usage on the plateform after 2015. The current usage metrics is available 48-96 hours after online publication and is updated daily on week days.
Initial download of the metrics may take a while.