Fig. 4
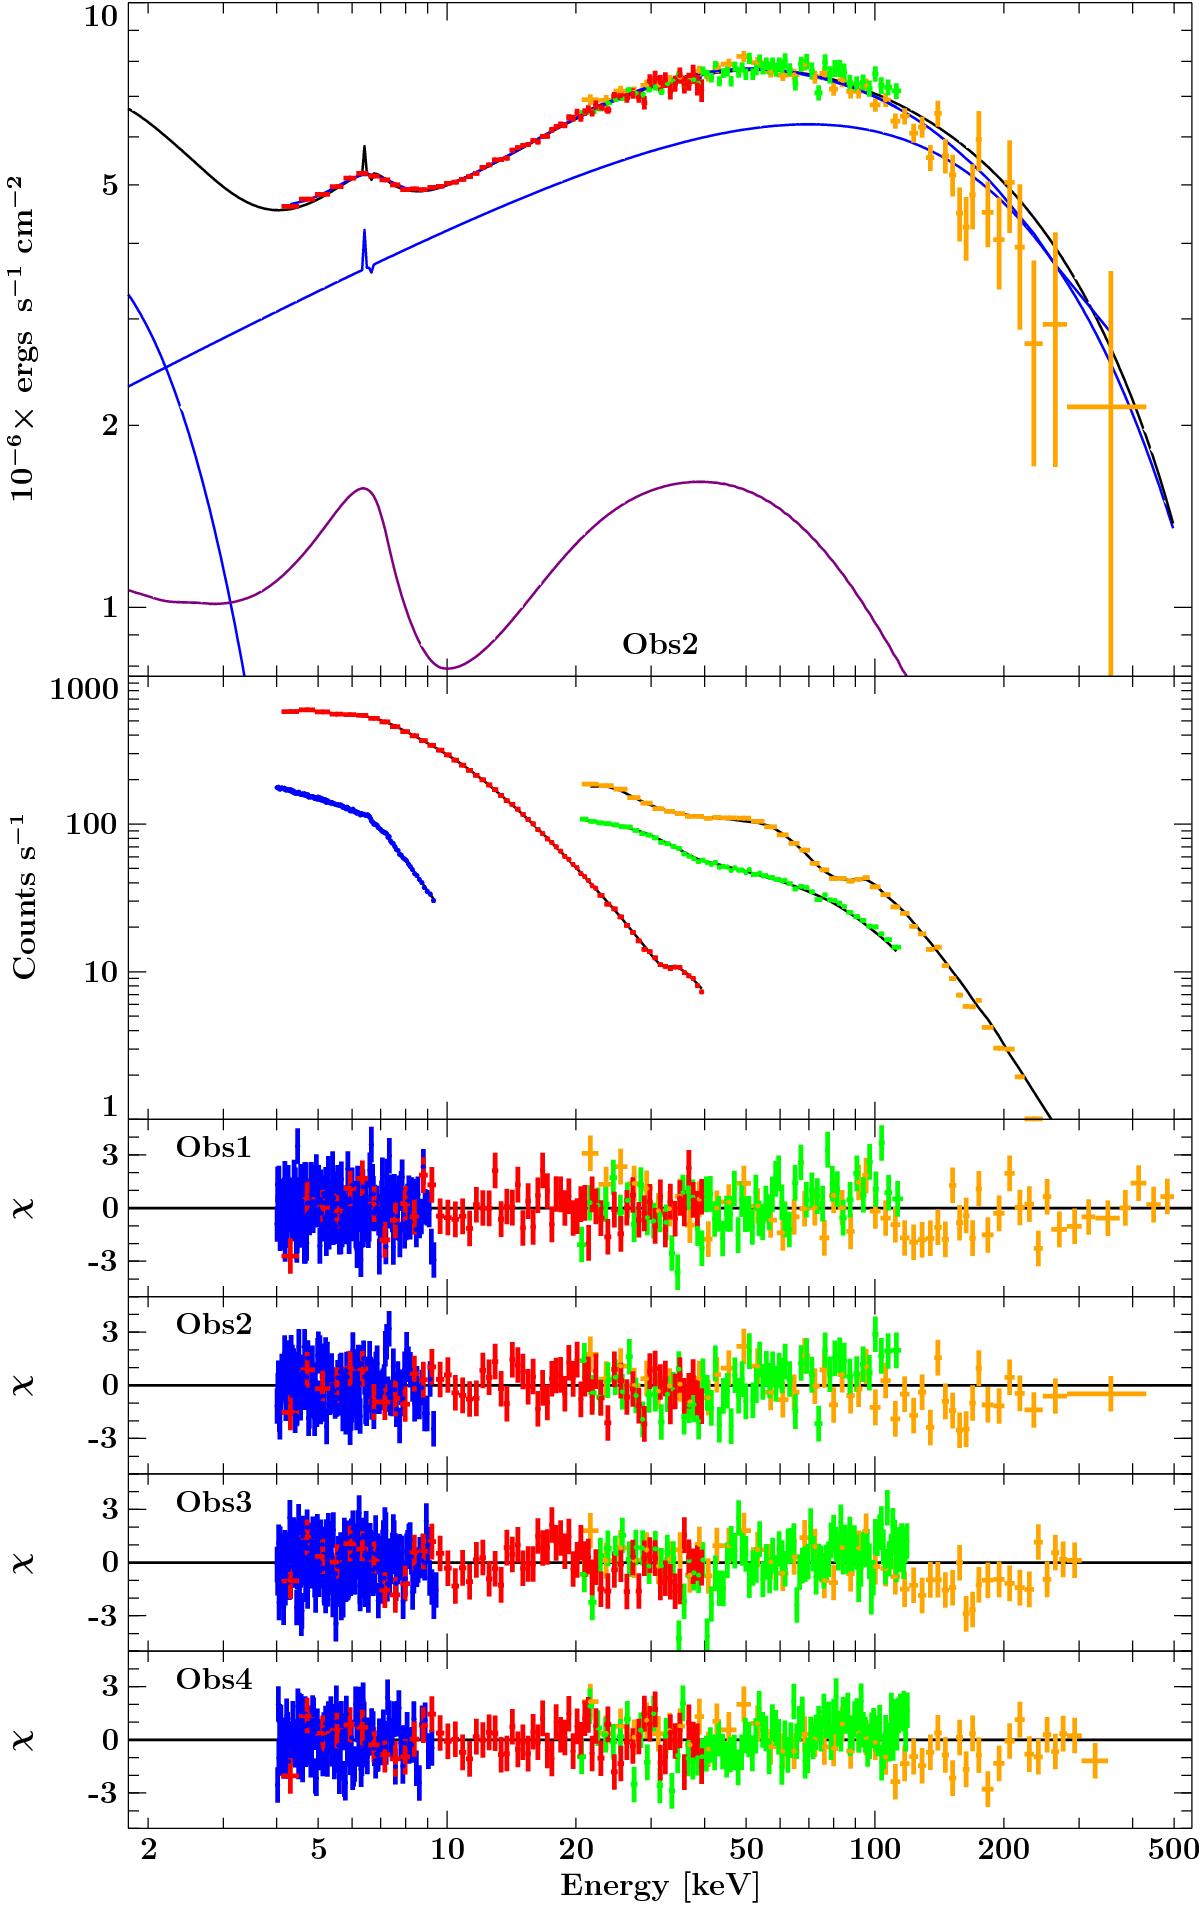
Spectral modeling of the joint data. Top: unfolded XMM-Newton, RXTE and INTEGRAL data and best fit model components for the Corona geometry for Obs2. Blue line: continuum spectrum including the narrow iron Kα emission line and the black body. Purple line: relativistically smeared reflection component. Second panel: measured count rate spectra. The four lowest panels show the best fit residuals for observations Obs1–Obs4. EPIC-pn is blue, PCA is red, HEXTE is green and ISGRI is orange.
Current usage metrics show cumulative count of Article Views (full-text article views including HTML views, PDF and ePub downloads, according to the available data) and Abstracts Views on Vision4Press platform.
Data correspond to usage on the plateform after 2015. The current usage metrics is available 48-96 hours after online publication and is updated daily on week days.
Initial download of the metrics may take a while.