Fig. 1
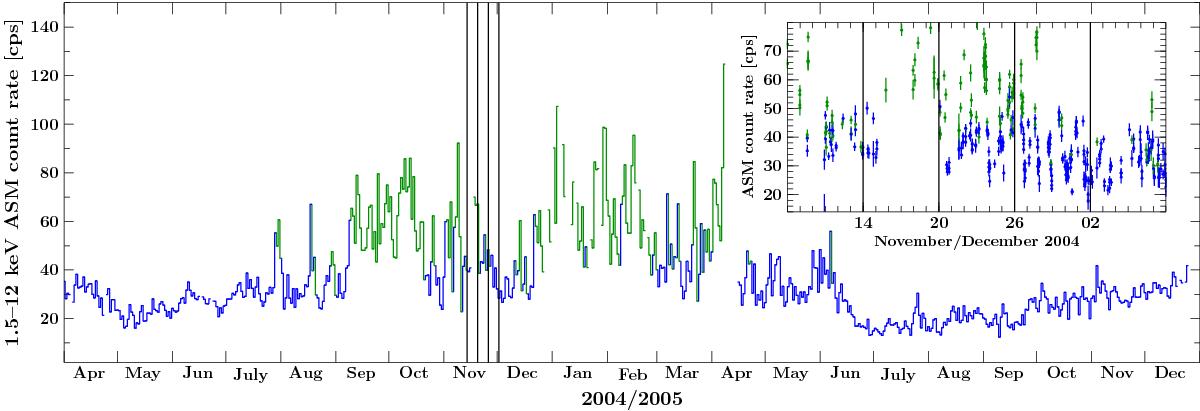
RXTE All Sky Monitor lightcurve of Cyg X-1 rebinned to a resolution of 1 d for the two year period surrounding the observations. The times of our four analyzed observations are marked with the vertical lines. Color coding corresponds to spectral state classification as defined by Grinberg et al. (2013): the blue color represents hard state, while the green color represents the intermediate state data. The inset is zoomed in on the four observations, with a resolution of one data point per spacecraft orbit.
Current usage metrics show cumulative count of Article Views (full-text article views including HTML views, PDF and ePub downloads, according to the available data) and Abstracts Views on Vision4Press platform.
Data correspond to usage on the plateform after 2015. The current usage metrics is available 48-96 hours after online publication and is updated daily on week days.
Initial download of the metrics may take a while.