Fig. 5
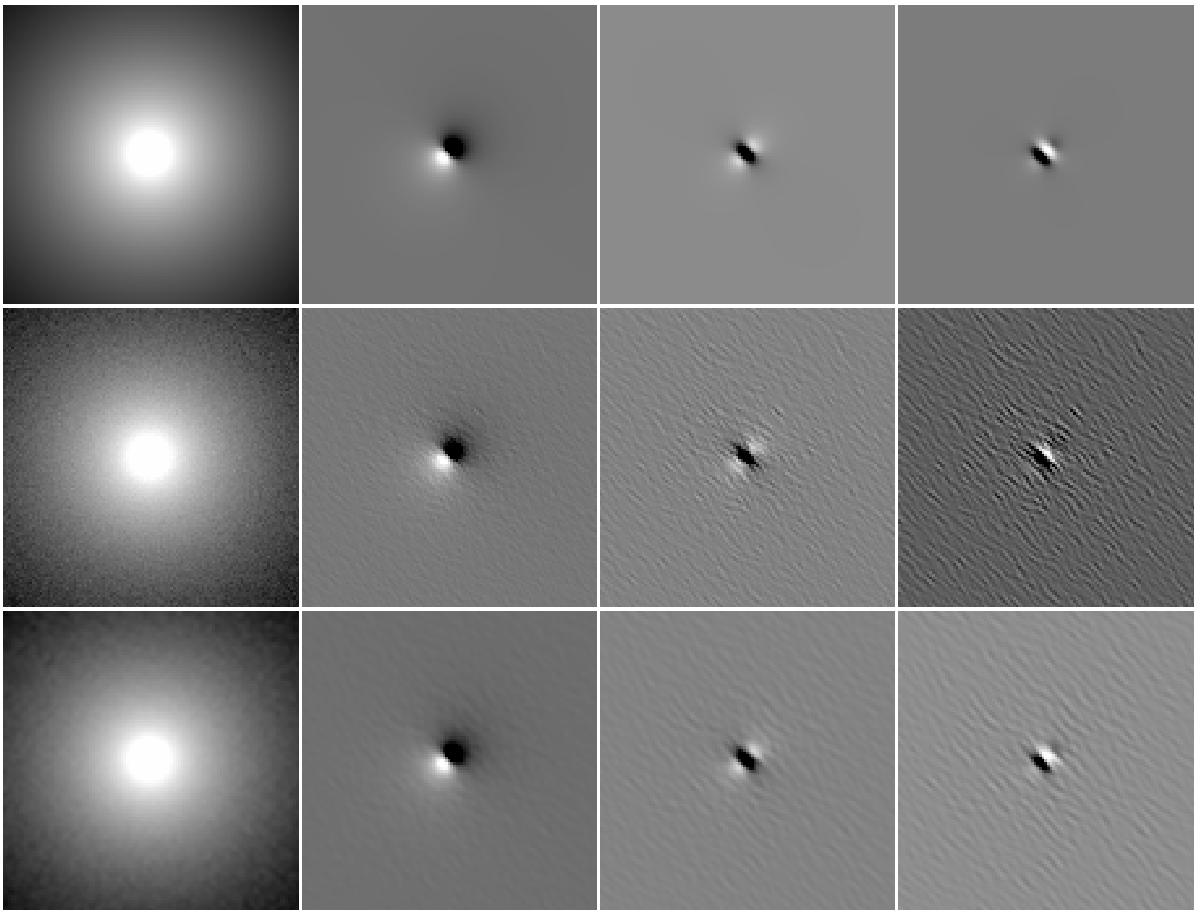
Illustration of the effect of de-noising R on the derivatives of the residual image. From left to right we show a simulated image of a galaxy (Sersic profile) and the three first derivatives of the residual image R in Eq. (19). The first row shows a noise-free image. The second row shows the derivatives of the non-de-noised residuals. The third row shows the derivatives computed using ![]() , with a significant improvement of the third derivatives.
, with a significant improvement of the third derivatives.
Current usage metrics show cumulative count of Article Views (full-text article views including HTML views, PDF and ePub downloads, according to the available data) and Abstracts Views on Vision4Press platform.
Data correspond to usage on the plateform after 2015. The current usage metrics is available 48-96 hours after online publication and is updated daily on week days.
Initial download of the metrics may take a while.