Fig. 2
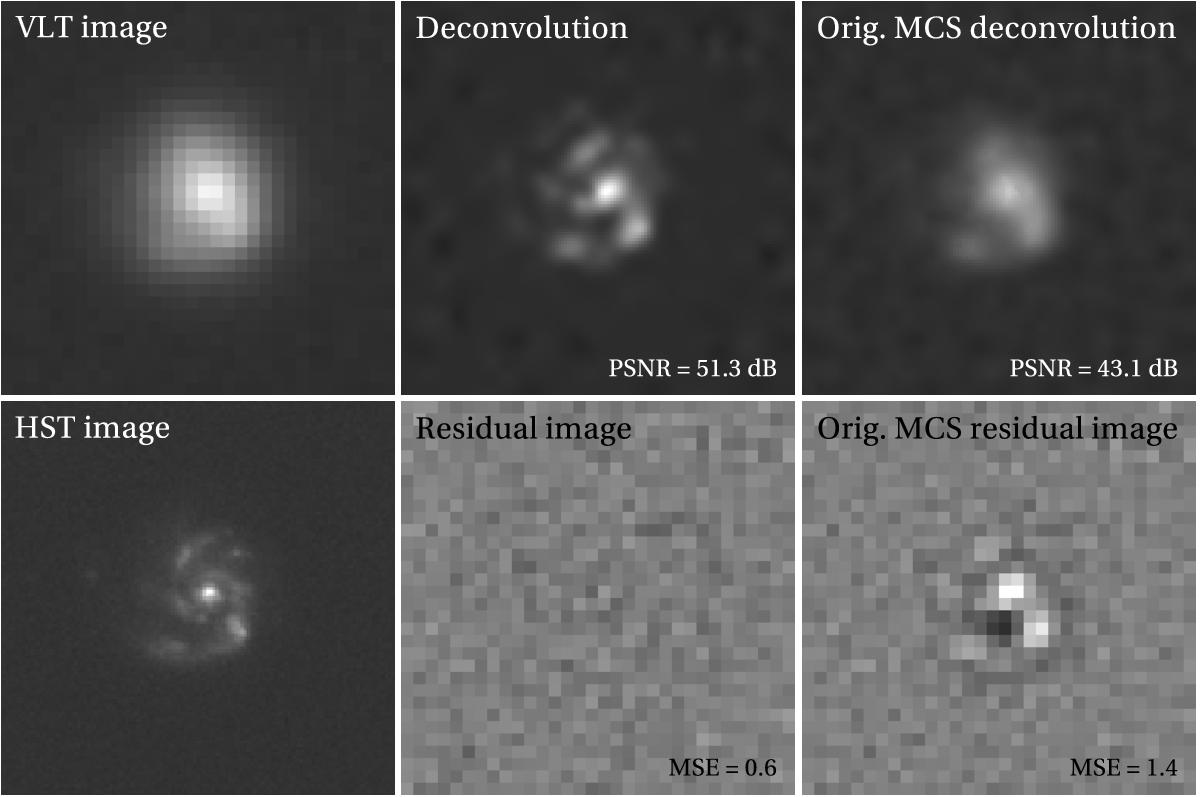
Effect of the regularization scheme on the deconvolution results. Left: a VLT/FORS2 optical image of a spiral galaxy is shown in the top panel, along with the HST/ACS observation of the same galaxy in the bottom panel. Middle: deconvolution with the new regularization scheme along with the residual image in the bottom panel. Right: same as in the middle panel, but with the regularization term used in the original MCS algorithm. The PSNR is given for each deconvolution, and the mean square errors (MSE) are given with the residual images.
Current usage metrics show cumulative count of Article Views (full-text article views including HTML views, PDF and ePub downloads, according to the available data) and Abstracts Views on Vision4Press platform.
Data correspond to usage on the plateform after 2015. The current usage metrics is available 48-96 hours after online publication and is updated daily on week days.
Initial download of the metrics may take a while.