Fig. 11
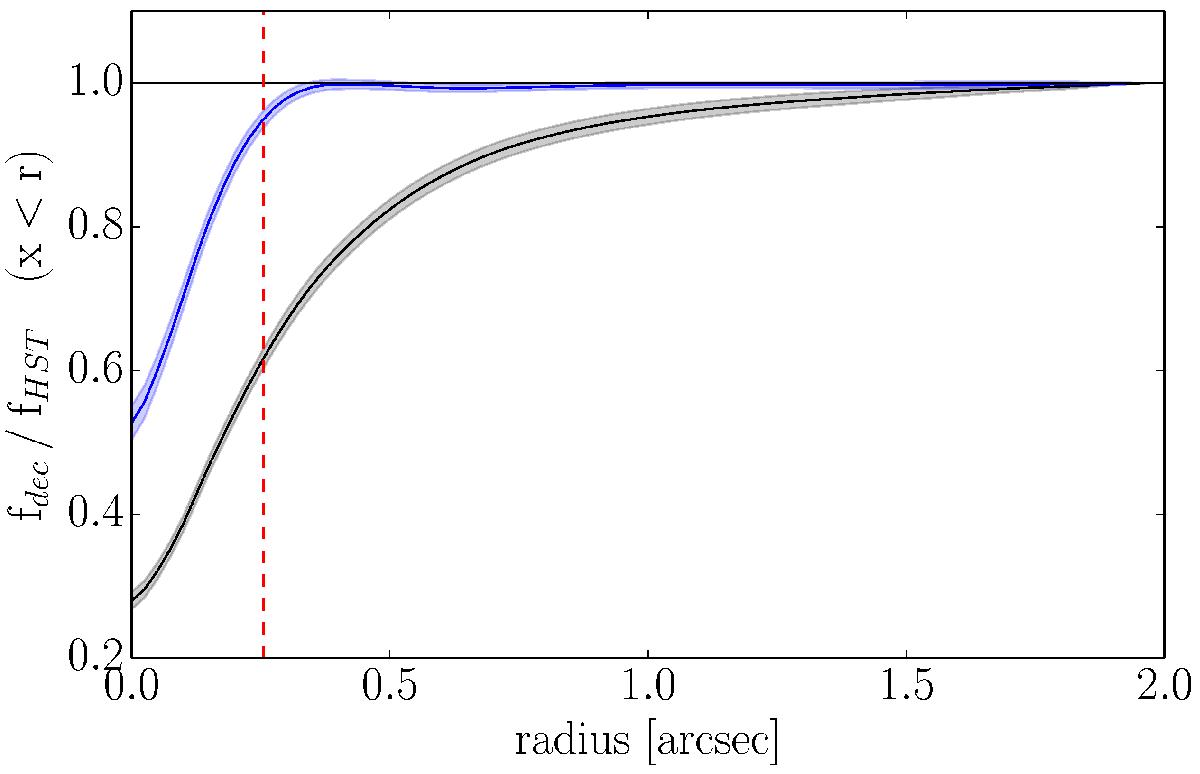
Ratio between the radial light profile of EDisCS galaxies as measured on the deconvolved VLT data and as measured on the HST data (blue). The same ratio is shown when the radial profile is measured on the original VLT data (black). The filled regions around the lines are the 3σ deviations around the mean value for the 143 galaxies. The red dotted line indicates the 95% flux limit fidelity for the deconvolved VLT data.
Current usage metrics show cumulative count of Article Views (full-text article views including HTML views, PDF and ePub downloads, according to the available data) and Abstracts Views on Vision4Press platform.
Data correspond to usage on the plateform after 2015. The current usage metrics is available 48-96 hours after online publication and is updated daily on week days.
Initial download of the metrics may take a while.