Fig. 10
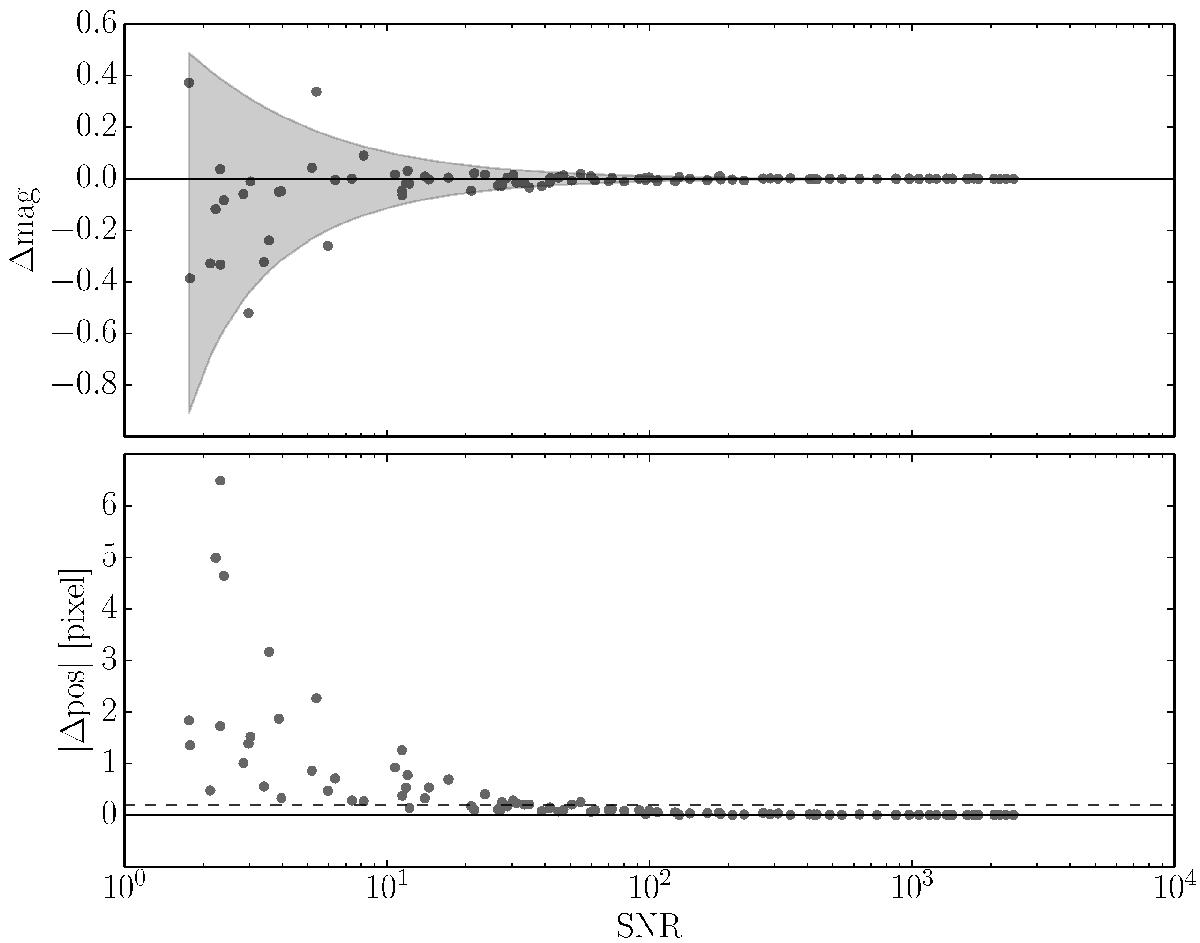
Point-source photometry and astrometry using the E-ELT simulation shown in Fig. 9. The differences in magnitude (top panel) and in position (bottom panel) with respect to the true values are shown as a function of S/N. The shaded area represents the photometric uncertainty in the data, as expected from the photon shot-noise. In the lower panel the astrometric accuracy is given in pixel units of the original image.The dotted line shows the 0.2 pixel limit. Most of the point sources with S/N> 20 are below this line.
Current usage metrics show cumulative count of Article Views (full-text article views including HTML views, PDF and ePub downloads, according to the available data) and Abstracts Views on Vision4Press platform.
Data correspond to usage on the plateform after 2015. The current usage metrics is available 48-96 hours after online publication and is updated daily on week days.
Initial download of the metrics may take a while.