| Issue |
A&A
Volume 589, May 2016
|
|
|---|---|---|
| Article Number | C3 | |
| Number of page(s) | 1 | |
| Section | Extragalactic astronomy | |
| DOI | https://doi.org/10.1051/0004-6361/201323059e | |
| Published online | 12 April 2016 | |
A new fitting-function to describe the time evolution of a galaxy’s gravitational potential (Corrigendum)
Kapteyn Astronomical Institute, University of Groningen,
PO Box 800,
9700 AV
Groningen,
The Netherlands
e-mail:
This email address is being protected from spambots. You need JavaScript enabled to view it.
Key words: galaxies: evolution / dark matter / errata, addenda
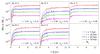 |
Fig. 1 Like Fig. 4 of Buist & Helmi (2014) but with the corrected values for the growth rate ag. |
The quoted values of the growth rate ag for the Aquarius haloes in Fig. 4 of Buist & Helmi (2014) are too small by a factor log (10) ≈ 2. This growth rate stems from fitting the evolution of the scale mass Ms(t) and scale radius rs(t) with a model where they grow as an exponential in redshift z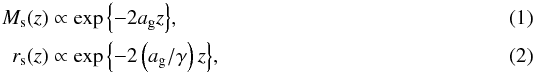 such that Ms(t) and rs(t) are related by a power law with coefficient γ. The quoted values of γ in the figure are correct. The curves shown in the figure are not affected, nor are any other figures in the article. A corrected version of Fig. 4 is shown in Fig. 1.
In the discussion of the results from the Milky-Way like Aquarius dark matter haloes we mentioned that the similarly defined growth rate ac of Mvir(t) (see Wechsler et al. 2002) was in the range 0.1 to 0.2 for these haloes, which was below the 68% scatter of the median given by Wechsler et al. in their Fig. 8. With the correction above, we now find ac in the range ≈0.2 to 0.4, which is still mostly below the median but within the 68% scatter.
The authors would like to thank Raphaël Errani for pointing out this error.
References
- Buist, H. J. T., & Helmi, A. 2014, A&A, 563, A110 [NASA ADS] [CrossRef] [EDP Sciences] [Google Scholar]
- Wechsler, R. H., Bullock, J. S., Primack, J. R., Kravtsov, A. V., & Dekel, A. 2002, ApJ, 568, 52 [NASA ADS] [CrossRef] [Google Scholar]
© ESO, 2016
All Figures
|
Fig. 1 Like Fig. 4 of Buist & Helmi (2014) but with the corrected values for the growth rate ag. |
| In the text | |
Current usage metrics show cumulative count of Article Views (full-text article views including HTML views, PDF and ePub downloads, according to the available data) and Abstracts Views on Vision4Press platform.
Data correspond to usage on the plateform after 2015. The current usage metrics is available 48-96 hours after online publication and is updated daily on week days.
Initial download of the metrics may take a while.