| Issue |
A&A
Volume 588, April 2016
|
|
|---|---|---|
| Article Number | L9 | |
| Number of page(s) | 4 | |
| Section | Letters | |
| DOI | https://doi.org/10.1051/0004-6361/201628412 | |
| Published online | 30 March 2016 | |
First 3 mm-VLBI imaging of the two-sided jet in Cygnus A
Zooming into the launching region
1
Max-Planck-Institut für Radioastronomie,
Auf dem Hügel 69,
53121
Bonn,
Germany
e-mail:
This email address is being protected from spambots. You need JavaScript enabled to view it.
2
Institut de Radioastronomie Millimétrique,
300 rue de la Piscine,
38406
Grenoble,
France
Received: 1 March 2016
Accepted: 11 March 2016
Abstract
Aims. We present for the first time Very Long Baseline Interferometry images of the radio galaxy Cygnus A at the frequency of 86 GHz. Thanks to the high spatial resolution of only ~200 Schwarzschild radii (RS), such observations provide an extremely detailed view of the nuclear regions in this archetypal object and allow us to derive important constraints for theoretical models describing the launching of relativistic jets.
Methods. A pixel-based analysis of the jet outflow, which still appears two-sided on the scales probed, was performed. By fitting Gaussian functions to the transverse intensity profiles, we could determine the jet width in the nuclear region.
Results. The base of the jets appears wide. The minimum measured transverse width of ~(227 ± 98) RS is significantly larger than the radius of the innermost stable circular orbit, suggesting that the outer accretion disk is contributing to the jet launching. The existence of a faster and Doppler de-boosted inner section, powered either from the rotation of the inner regions of the accretion disk or by the spinning black hole, is suggested by the kinematic properties and by the observed limb brightening of the flow.
Key words: instrumentation: high angular resolution / galaxies: active / galaxies: jets
© ESO, 2016
1. Introduction
The launching mechanism of relativistic extragalactic jets is a much debated and crucial topic for understanding these fascinating objects. There is currently a broad consensus on the fundamental role that the strong magnetic fields anchored in the accretion disk play in the process. However, to fully reproduce the observed properties of such magnetically-driven jets, e.g. Lorentz factors as high as ~50 and opening angles as small as half a degree, is still a challenge for theorists. General relativistic MHD simulations (e.g. Tchekhovskoy et al. 2011) have shown that highly collimated, relativistic jets can be efficiently powered by the black hole’s rotational energy extracted through the magnetic field, as described in the work of Blandford & Znajek (1977). This scenario is supported by a recent observational study of a large sample of blazars (Ghisellini et al. 2014), indicating that the contribution of a spinning black hole is necessary to account for the estimated jet powers. Alternatively, the rotation of the accretion disk has been proposed as a viable power source for magnetic jet launching (Blandford & Payne 1982). Predictions for the terminal Lorentz factor of such disk winds are diverse, with values ranging from mildly relativistic (Γ < 3, McKinney & Gammie 2004; De Villiers et al. 2005) to relativistic (Γ ~ 10, Komissarov et al. 2007).
A fundamental tool for discriminating between the two launching mechanisms is the direct imaging of the jet base through VLBI observations and the determination of its transverse size. This kind of study has been rarely performed because the jet base is usually not resolved. Moreover, owing to synchrotron opacity effects (Königl 1981), the location of the VLBI core is often shifted at large distances, ~104−106 Schwarzschild radii (RS), from the black hole (e.g. Marscher et al. 2008). One exception is M 87, for which a distance of only 14−23 RS has been inferred for the 43 GHz core (Hada et al. 2011). In the same source, VLBI pilot studies at 1.3 mm (with the Event Horizon Telescope) have determined a core size of ~5.5 RS (Doeleman et al. 2012), which represents an upper limit for the true size of the jet apex. This important measurement indicates that the jet of M 87 is likely anchored close to the innermost stable circular orbit (ISCO). Performing such an analysis in other sources is clearly fundamental for testing the variety of possible scenarios. However, while future instruments with improved capabilities (e.g. phased ALMA) will certainly enrich the sample of suitable targets, this is currently quite limited.
In this Letter we present, for the first time, a detailed imaging of the jet base in Cygnus A through global VLBI observations at 86 GHz (GMVA). Among the powerful FR II radio galaxies, Cygnus A is one of the very few two-sided sources whose jet launching region can be probed with sufficient sensitivity at high radio frequencies. At the source redshift (z = 0.056)1 and assuming a black hole mass of 2.5 × 10⁹ M⊙ (Tadhunter et al. 2003), GMVA observations allow scales of the order of 102 RS to be probed. The large jet viewing angle enables a prominent counter-jet to be detected in this source, which represents a fundamental advantage when investigating the nuclear regions of a jet. In fact, since the transverse width can be determined continuously along the two-sided flow, the assumption-dependent back-extrapolations of the properties of the jet apex can be replaced by actual measurements.
The following analysis complements a previous VLBI study at 43 GHz of the jet transverse profile and of the kinematic properties (Boccardi et al. 2016, hereafter B1). This revealed the presence of a pronounced transverse stratification, both in flux density (limb brightening) and bulk Lorentz factor (1 ≲ Γ ≲ 2.5), typical of a flow with spine-sheath structure.
2. Observations and VLBI images
The GMVA data set comprises three epochs from observations in 2009/2010 with a cadence between five and seven months (Table 1). The duration of the observations was 15−16 h, ~8 of which were spent on Cygnus A. This, together with the large number of antennas employed and with the favourable declination of the source, enabled good uv-coverage. Data were recorded in single polarization mode with a recording rate of 512 Mb/s, which corresponds to an observing bandwidth of 128 MHz. The correlation took place at the MPIfR in Bonn, Germany. The data reduction was carried out in AIPS (Greisen 1990). Aside from the standard calibration procedures, special care was devoted during the fringe fitting. First, as described in Martí-Vidal et al. (2012), the manual phase calibration was applied. Single sub-band phases and delays were calculated using one or more scans showing strong detections from the calibrator J2015+3710. Then, the global fringe fitting was performed (Schwab & Cotton 1983). The amplitude calibration was based on the measured system temperatures and gain curves at each telescope, and it included a correction for atmospheric opacity.
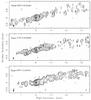 |
Fig. 1 Clean maps of Cygnus A at 86 GHz from GMVA observations in 2009−2010. Contours represent isophotes at 0.6, 1.2, 2.4, 4.8, 9.6, 19.2, 38.4 mJy/beam. The data weighting is uniform. The beam sizes are slightly larger compared to the values reported in Table 1 due to the application of a Gaussian taper of 0.1 at a uv-radius of 3000 Mλ. The typical noise level in the images is ~0.15mJy/beam. |
The imaging and self-calibration of amplitude and phase were performed in DIFMAP (Shepherd et al. 1994). The final clean maps obtained are presented in Fig. 1. The nuclear region is detected with a high signal-to-noise ratio S/N (between ~1200−2000), with the brightest feature – which we refer to as the “core” – showing a prominent variability over the monitoring period. The total flux density varies between ~0.65 and 1 Jy and is consistent with the measurement of ~1Jy provided by 86 GHz single-dish observations at IRAM (Agudo et al. 2010). The amplitude variation during the self-calibration procedure was not greater than ~30%, thus this percentage can be assumed as the uncertainty associated with the flux density measurements.
A visual inspection of the maps already shows the high morphological complexity of Cygnus A at this frequency and at this angular resolution. A prominent counter-jet is detected in all three epochs. The jet emission is relatively smooth – i.e. there are no bright features besides the core – but at the same time rich with sub-structures. It can also be noticed that, due to the low S/N in the faintest regions, the emission is not detected over the full jet cross-section in a single epoch. The jet structure can be recovered much better after stacking the three maps, as shown in Fig. 2. In this image, characterized by a reduced noise level of ~0.1mJy/beam, the jet limb brightening already observed at 43 GHz also appears to be better defined, especially in the outer and faintest regions of the approaching jet.
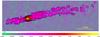 |
Fig. 2 Stacked image of Cygnus A at 86 GHz. Each single epoch was restored with a circular beam of 0.1 mas. The alignment was based on the position of the peak of intensity. Contours represent isophotes at 0.4, 0.8, 1.6, 3.2, 6.4, 12.8, 51.6, 102.4, 204.8 mJy/beam. |
3. Analysis and discussion
3.1. Transverse width profile
The analysis of the jet transverse structure in Cygnus A was first presented at the frequency of 43 GHz in B1. In this study it was shown that the flow emanates parabolically from the position of an emission gap located at ~0.2 mas east of the brightest feature. A measurement of the jet transverse width was also provided for the nuclear region. However, the minimum size of ~30 μas occurring in the vicinity of the faint emission gap was about seven times smaller than the beam size in the transverse direction. In this Letter we exploit the improved resolution achieved by GMVA observations for obtaining a more solid estimate of the transverse width at the base of the flow. Given the better quality and the reduced noise level of the stacked image as compared to the single epochs, we focus our analysis on the former. The stacked image was restored with a circular beam of 0.1 mas, which is approximately the natural resolution in the transverse direction (Table 1). Then, it was sliced pixel by pixel (1 px = 0.02 mas) along the jet axis using the aips task slice. The transverse intensity distribution in each slice was finally fitted with a single Gaussian profile using the task slfit.
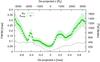 |
Fig. 3 Transverse width profile at 86 GHz for the stacked image. Error bars for the width measurements (green points with label dmeas) are assumed equal to 1/5 of each convolved FWHM. The dashed black line with label dlim indicates the profile of the resolution limit. |
Figure 3 shows the dependence of the de-convolved jet width on the distance from the core z in the central ~1.5 mas of the source. The distance z, also expressed in RS, was de-projected assuming a viewing angle θ = 74.5° (as calculated in B1). The error bars are conservatively assumed equal to one fifth of the measured FWHM. The minimum jet width dmin occurs for z = −0.02 mas, where the measured transverse size is dmin = (51 ± 22) μas. This corresponds to about half of the nominal resolution in the transverse direction. However, as discussed by several authors (e.g. Fomalont 1989; Lobanov 2005; Kovalev et al. 2005), the limiting resolution of a certain brightness distribution mainly depends on the S/N of the detection. Following Lobanov (2005), the resolution limit dlim for the case of a Gaussian profile fitted to a brightness distribution with uniform weighting is 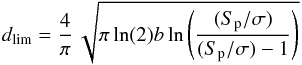 (1)where Sp is the peak flux density of the transverse intensity profile, σ is the rms noise of the map and b the equivalent circular beam (for uniform weighting) expressed as a function of the major and minor beam axes, bmaj and bmin, as
  . The value of dlim was calculated for each slice, and its profile as a function of z is also reported in Fig. 3. Except for a faint area in the counter-jet (z ~ −0.5 mas), the measured width is everywhere well above the resolution limit, therefore the jet is resolved in the nuclear region.
3.2. Minimum width and implications for the jet launching
The minimum jet width dmin = (51 ± 22)μas measured at 86 GHz translates into a linear size of ~(227 ± 98)RS. Unlike the case of M 87 (Doeleman et al. 2012), the jet apex appears to be much wider than the ISCO radius, which varies between 1 and 9 RS depending on the BH spin and on the kind of orbit (prograde or retrograde) of the BH/accretion disk system. These results suggest that at least part of the jet base in Cygnus A is anchored at large disk radii from the central BH, i.e. the outer regions of the accretion disk are involved in the jet launching process. Based on the sub-parsec scale kinematic study presented in B1, we infer that such a disk wind is characterized by mildly relativistic speeds, with the bulk Lorentz factor varying from Γ ~ 1 at the jet edge to Γ ~ 2.5 in sections of the flow closer to the jet axis.
We point out, however, that our width measurement does not exclude the existence of both a narrower and an even broader component. Concerning the former, it should be recalled that in jets seen at large viewing angles Doppler de-boosting affects not only the receding side but also the approaching one. For sufficiently high speeds, the Doppler factor can be much smaller than one, so that the flow is completely invisible. In the case of Cygnus A, the gradual fading of the accelerating inner-jet components was directly observed in our kinematic analysis. This, together with the observed limb brightening, strongly indicate that an invisible faster flow exists in the central body of the jet. This spine may be driven either from the rotation of the inner regions of the accretion disk or by the spinning black hole itself. A hypothetical broader and diffuse disk wind, instead, is likely resolved out in these high resolution images. Indeed VLBI observations at 5 GHz (Carilli et al. 1991) support the existence of such a component. At this frequency, the jet appears as an almost cylindrical resolved flow with transverse width between 2 and 2.2 mas, i.e. of the order of 9000 RS. Although this large size may partially be the effect of scattering in the interstellar medium, there is an indication that the jet base extends to much larger disk radii than measured at 86 GHz.
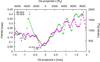 |
Fig. 4 Width profiles at 43 and 86 GHz. At 43 GHz, the analysis was performed on the stacked image presented in B1, Fig. 2. The arrow indicates the position of the emission gap in the 43 GHz map. |
3.3. Comparison with results at 43 GHz
The discussion in the previous section has not quite addressed the problem of truly locating the central engine in Cygnus A. Given the roughly symmetric expansion of jet and counter-jet shown in Fig. 3, the most natural interpretation would be that the supermassive black hole is located in the vicinity of z ~ 0. However, although the jet base is assumed to be the narrowest part of the jet in the simplest models, this may not necessarily be the case. An interesting argument comes from the comparison of the 86 GHz width profile with results at 43 GHz. For the purposes of the comparison, the analysis was repeated at the two frequencies following the method described in Sect. 3.1 after convolving the maps with the same circular beam of 0.15 mas. Results are presented in Fig. 4. We first notice that the dip in the 43 GHz profile at z ~ −0.25 mas, i.e. in the vicinity of the gap of emission, is not observed at 86 GHz. Correspondingly, the 86 GHz map (Fig. 3) does not show a pronounced emission gap2. The observed frequency dependence of the properties of this region supports the idea that the gap is the result of absorption, which becomes very reduced at 86 GHz. If synchrotron opacity is responsible for the it, the gap most likely marks the true location of the central engine. A detailed spectral analysis using more sensitive data is in progress with the aim of clarifying the nature of this feature. Absorption may also explain another striking aspect of the width profiles in Fig. 4. While results at the two frequencies are quite consistent in the jet side, the 43 GHz counter-jet appears narrower than at 86 GHz. The puzzling asymmetry between the opening angles of the approaching and receding side observed at 43 GHz in B1, almost disappears at 86 GHz. The existence of a parsec scale free-free absorber covering the counter-jet was suggested by several studies (Krichbaum et al. 1998; Bach et al. 2004; Struve & Conway 2010) and may well explain the observed features. The results presented in this Letter hint at the presence of sub-pc scale material that is still highly opaque at 43 GHz but not at 86 GHz.
4. Conclusions
We have presented the first VLBI images of the radio galaxy Cygnus A at the frequency of 86 GHz. The enhanced spatial resolution of these maps allowed us to investigate the transverse width profile at the onset of the two-sided flow. The jet base appears wide with a minimum width of ~(227 ± 98)RS. This value is much higher than the ISCO radius, thus we infer that the emission is produced by a mildly relativistic, parabolically expanding disk wind. The existence of a central and faster jet, possibly driven by the black hole and invisible due to Doppler de-boosting, is however not excluded. It is, on the contrary, suggested by the kinematic properties and by the observed limb brightening of the flow. In the hypothesis that the Blandford & Znajek (1977) and Blandford & Payne (1982) mechanisms act simultaneously in relativistic jets, giving rise to a spine-sheath structure of the flow (e.g. Hardee et al. 2007; Xie et al. 2012), we indeed expect the slower disk wind to always dominate the emission in radio galaxies and the BH-driven jet to be the main observable component in blazars due to differential boosting. The comparison of the width profiles at 43 and 86 GHz indicates that free-free opacity and/or synchrotron opacity are still strong at 43 GHz but not at 86 GHz. Observing at high radio frequencies is therefore fundamental for unveiling the physical properties of jets at their onset.
1mas ~ 1.084pc, assuming a ΛCDM cosmology with H0 = 70.5h-1km s-1 Mpc-1, ΩM = 0.27, ΩΛ = 0.73.
In principle, this comparison may be affected by a misalignment of the maps due to an opacity shift of the cores. However, this is expected to be negligible at high frequencies, as confirmed by a cross-correlation of the jet parameters from which we infer a shift <30 μas.
Acknowledgments
We thank the referee for helpful comments. We also thank Andrei Lobanov and Vassilis Karamanavis for the useful discussions, and Michael Lindqvist for his support during the observations at Onsala. This research has made use of data obtained with the Global Millimeter VLBI Array (GMVA), which consists of telescopes operated by the MPIfR, IRAM, Onsala, Metsahovi, Yebes and the VLBA. The data were correlated at the correlator of the MPIfR in Bonn, Germany. The VLBA is an instrument of the National Radio Astronomy Observatory, a facility of the National Science Foundation operated under cooperative agreement by Associated Universities, Inc.
References
- Agudo, I., Thum, C., Wiesemeyer, H., & Krichbaum, T. P. 2010, ApJS, 189, 1 [NASA ADS] [CrossRef] [Google Scholar]
- Bach, U., Krichbaum, T. P., Middelberg, E., et al. 2004, in European VLBI Network on New Developments in VLBI Science and Technology, eds. R. Bachiller, F. Colomer, J.-F. Desmurs, & P. de Vicente, 155 [Google Scholar]
- Blandford, R. D., & Znajek, R. L. 1977, MNRAS, 179, 433 [NASA ADS] [CrossRef] [Google Scholar]
- Blandford, R. D., & Payne, D. G. 1982, MNRAS, 199, 883 [NASA ADS] [CrossRef] [Google Scholar]
- Boccardi, B., Krichbaum, T. P., Bach, U., et al. 2016, A&A, 585, A33 [NASA ADS] [CrossRef] [EDP Sciences] [Google Scholar]
- Carilli, C. L., Bartel, N., & Linfield, R. P. 1991, AJ, 102, 1691 [NASA ADS] [CrossRef] [Google Scholar]
- De Villiers, J.-P., Hawley, J. F., Krolik, J. H., & Hirose, S. 2005, ApJ, 620, 878 [NASA ADS] [CrossRef] [Google Scholar]
- Doeleman, S. S., Fish, V. L., Schenck, D. E., et al. 2012, Science, 338, 355 [NASA ADS] [CrossRef] [PubMed] [Google Scholar]
- Fomalont, E. B. 1989, in Synthesis Imaging in Radio Astronomy, eds. R. A. Perley, F. R. Schwab, & A. H. Bridle, ASP Conf. Ser., 6, 213 [Google Scholar]
- Ghisellini, G., Tavecchio, F., Maraschi, L., Celotti, A., & Sbarrato, T. 2014, Nature, 515, 376 [NASA ADS] [CrossRef] [Google Scholar]
- Greisen, E. W. 1990, in Acquisition, Processing and Archiving of Astronomical Images, eds. G. Longo, & G. Sedmak, 125 [Google Scholar]
- Hada, K., Doi, A., Kino, M., et al. 2011, Nature, 477, 185 [NASA ADS] [CrossRef] [PubMed] [Google Scholar]
- Hardee, P., Mizuno, Y., & Nishikawa, K.-I. 2007, Ap&SS, 311, 281 [NASA ADS] [CrossRef] [Google Scholar]
- Komissarov, S. S., Barkov, M. V., Vlahakis, N., & Königl, A. 2007, MNRAS, 380, 51 [NASA ADS] [CrossRef] [Google Scholar]
- Königl, A. 1981, ApJ, 243, 700 [NASA ADS] [CrossRef] [Google Scholar]
- Kovalev, Y. Y., Kellermann, K. I., Lister, M. L., et al. 2005, AJ, 130, 2473 [NASA ADS] [CrossRef] [Google Scholar]
- Krichbaum, T. P., Alef, W., Witzel, A., et al. 1998, A&A, 329, 873 [NASA ADS] [Google Scholar]
- Lobanov, A. P. 2005, ArXiv e-prints [arXiv:astro-ph/0503225] [Google Scholar]
- Marscher, A. P., Jorstad, S. G., D’Arcangelo, F. D., et al. 2008, Nature, 452, 966 [NASA ADS] [CrossRef] [PubMed] [Google Scholar]
- Martí-Vidal, I., Krichbaum, T. P., Marscher, A., et al. 2012, A&A, 542, A107 [NASA ADS] [CrossRef] [EDP Sciences] [Google Scholar]
- McKinney, J. C., & Gammie, C. F. 2004, ApJ, 611, 977 [NASA ADS] [CrossRef] [Google Scholar]
- Schwab, F. R., & Cotton, W. D. 1983, AJ, 88, 688 [NASA ADS] [CrossRef] [Google Scholar]
- Shepherd, M. C., Pearson, T. J., & Taylor, G. B. 1994, BAAS, 26, 987 [NASA ADS] [Google Scholar]
- Struve, C., & Conway, J. E. 2010, A&A, 513, A10 [NASA ADS] [CrossRef] [EDP Sciences] [Google Scholar]
- Tadhunter, C., Marconi, A., Axon, D., et al. 2003, MNRAS, 342, 861 [NASA ADS] [CrossRef] [Google Scholar]
- Tchekhovskoy, A., Narayan, R., & McKinney, J. C. 2011, MNRAS, 418, L79 [NASA ADS] [CrossRef] [Google Scholar]
- Xie, W., Lei, W.-H., Zou, Y.-C., et al. 2012, RA&A, 12, 817 [Google Scholar]
All Tables
All Figures
|
Fig. 1 Clean maps of Cygnus A at 86 GHz from GMVA observations in 2009−2010. Contours represent isophotes at 0.6, 1.2, 2.4, 4.8, 9.6, 19.2, 38.4 mJy/beam. The data weighting is uniform. The beam sizes are slightly larger compared to the values reported in Table 1 due to the application of a Gaussian taper of 0.1 at a uv-radius of 3000 Mλ. The typical noise level in the images is ~0.15mJy/beam. |
| In the text | |
|
Fig. 2 Stacked image of Cygnus A at 86 GHz. Each single epoch was restored with a circular beam of 0.1 mas. The alignment was based on the position of the peak of intensity. Contours represent isophotes at 0.4, 0.8, 1.6, 3.2, 6.4, 12.8, 51.6, 102.4, 204.8 mJy/beam. |
| In the text | |
|
Fig. 3 Transverse width profile at 86 GHz for the stacked image. Error bars for the width measurements (green points with label dmeas) are assumed equal to 1/5 of each convolved FWHM. The dashed black line with label dlim indicates the profile of the resolution limit. |
| In the text | |
|
Fig. 4 Width profiles at 43 and 86 GHz. At 43 GHz, the analysis was performed on the stacked image presented in B1, Fig. 2. The arrow indicates the position of the emission gap in the 43 GHz map. |
| In the text | |
Current usage metrics show cumulative count of Article Views (full-text article views including HTML views, PDF and ePub downloads, according to the available data) and Abstracts Views on Vision4Press platform.
Data correspond to usage on the plateform after 2015. The current usage metrics is available 48-96 hours after online publication and is updated daily on week days.
Initial download of the metrics may take a while.