Fig. 2
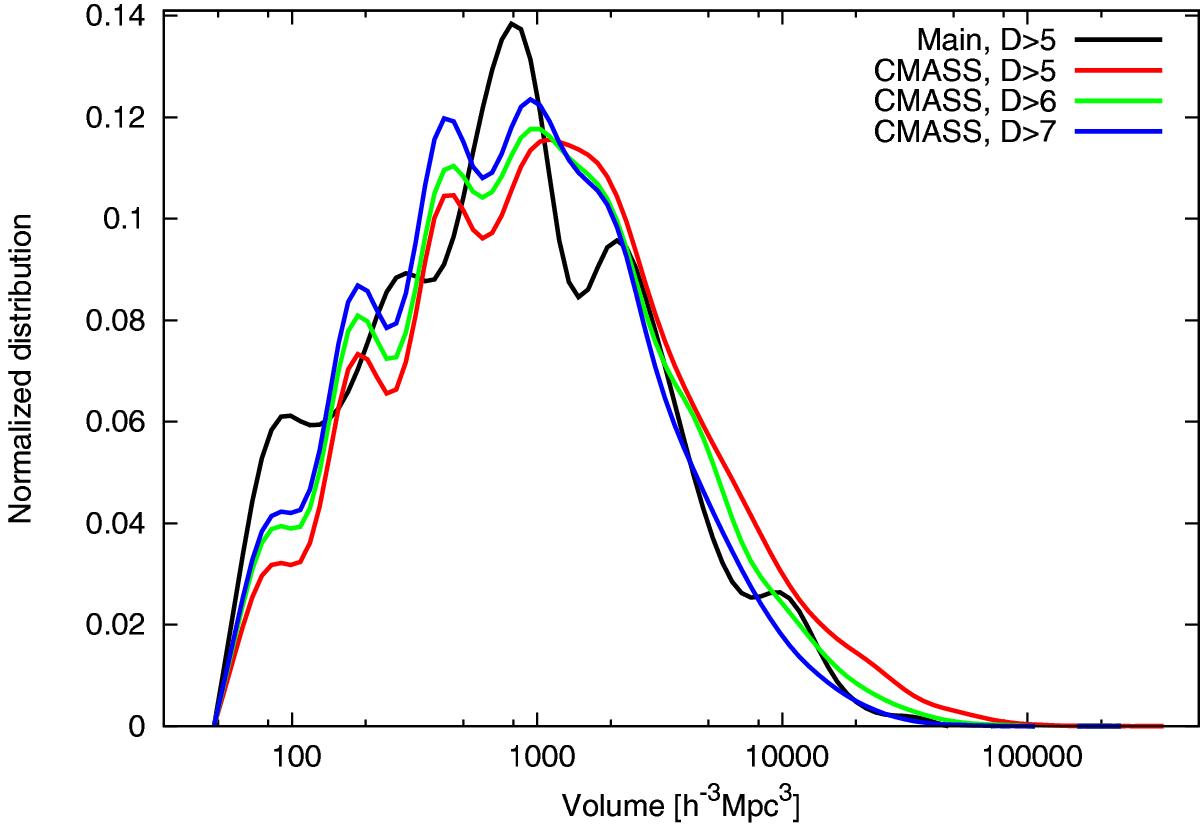
Distribution of supercluster volumes. For comparison, the distribution of the SDSS DR7 main sample is shown with the black curve. The CMASS supercluster volume distribution is shown for three density thresholds (in units of mean density): D> 5 (red), D> 6 (green), and D> 7 (blue).
Current usage metrics show cumulative count of Article Views (full-text article views including HTML views, PDF and ePub downloads, according to the available data) and Abstracts Views on Vision4Press platform.
Data correspond to usage on the plateform after 2015. The current usage metrics is available 48-96 hours after online publication and is updated daily on week days.
Initial download of the metrics may take a while.