Fig. 9
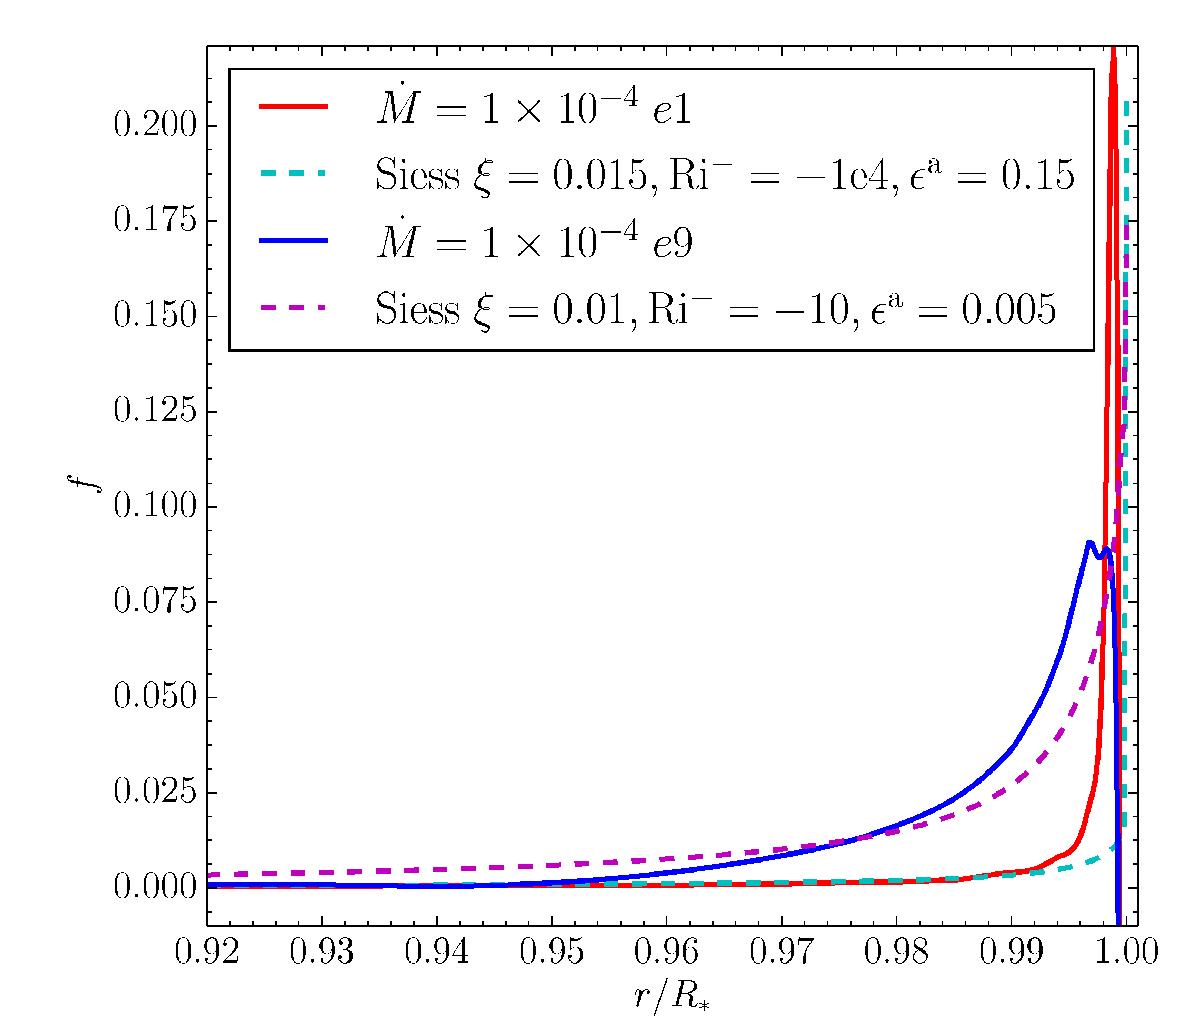
Comparison between penetration functions derived from our 2D simulations and that from the analytic model of Siess & Forestini (1996). The figure shows a comparison for the e1 simulation (solid red curve) with our best fit analytic function (dashed cyan curve) and a comparison for the e9 simulation (solid blue curve) with our best fit analytic function (dashed maroon curve).
Current usage metrics show cumulative count of Article Views (full-text article views including HTML views, PDF and ePub downloads, according to the available data) and Abstracts Views on Vision4Press platform.
Data correspond to usage on the plateform after 2015. The current usage metrics is available 48-96 hours after online publication and is updated daily on week days.
Initial download of the metrics may take a while.