Fig. 7
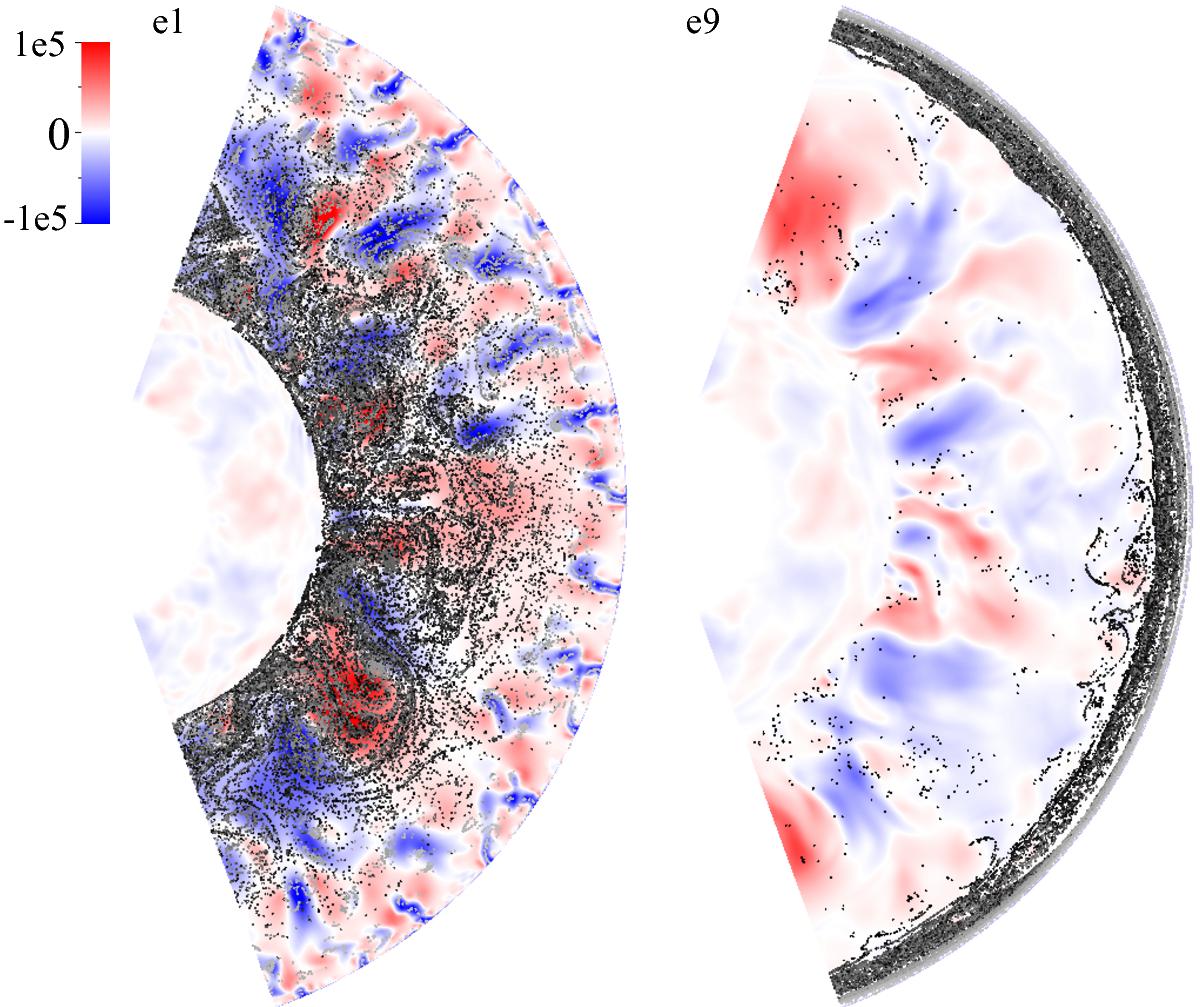
Distribution of tracer particles accreted during 1.5 × 10⁷ s for the low energy (e1) and high energy accretion (e9) cases respectively. Colour scale is the radial velocity in units of cm s-1 and grey scale points show the position of the tracer particles. Velocities are instantaneous, i.e. not time-averaged. Blue indicates down flows, while red indicates up flows. Lighter coloured points correspond to more recently added tracer particles. Both snapshots are at a time t = 1.5 × 10⁷ s.
Current usage metrics show cumulative count of Article Views (full-text article views including HTML views, PDF and ePub downloads, according to the available data) and Abstracts Views on Vision4Press platform.
Data correspond to usage on the plateform after 2015. The current usage metrics is available 48-96 hours after online publication and is updated daily on week days.
Initial download of the metrics may take a while.