Fig. 8
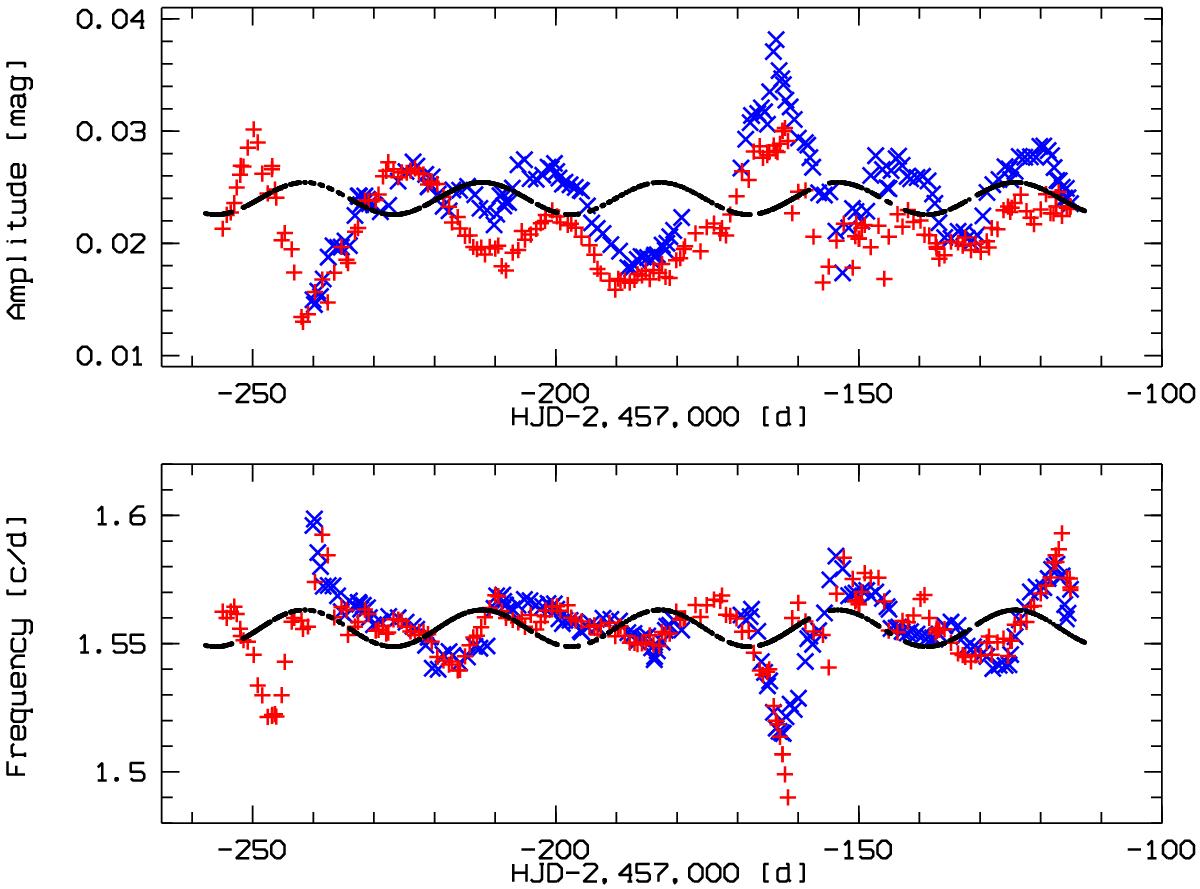
Time dependence of the frequency (lower panel) and amplitude (upper panel) of the 1.5562-c/d variability in η Cen (red passband: +; blue passband: ×). Frequencies and amplitudes were determined as sliding averages over three-day intervals from sine fits. For comparison, the sine curve fitted to the light curve in Fig. 4 is overplotted with arbitrary scaling and vertical offset (note that the magnitude scale is inverted).
Current usage metrics show cumulative count of Article Views (full-text article views including HTML views, PDF and ePub downloads, according to the available data) and Abstracts Views on Vision4Press platform.
Data correspond to usage on the plateform after 2015. The current usage metrics is available 48-96 hours after online publication and is updated daily on week days.
Initial download of the metrics may take a while.