Fig. 13
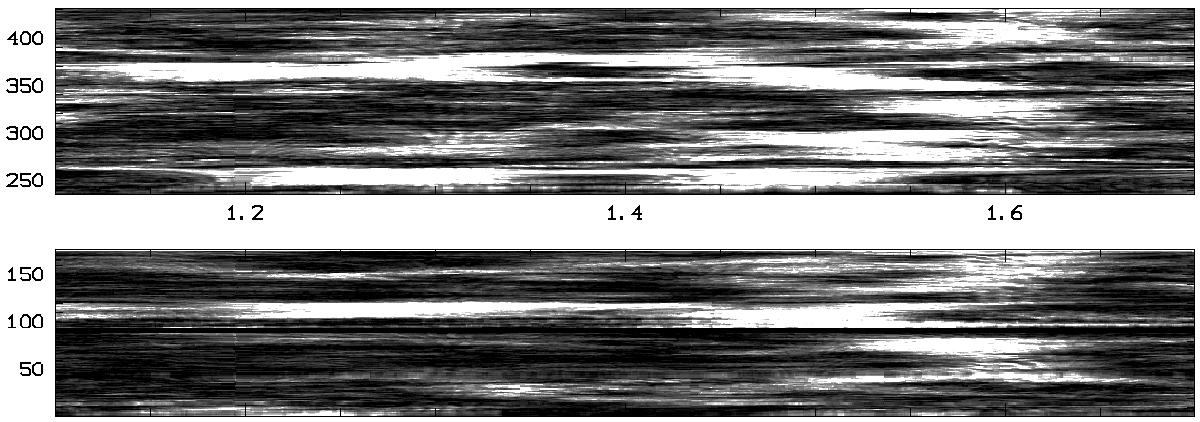
Time-frequency diagram (bottom image: blue passband; top image: red passband) of the Type II frequency group around 1.55 c/d in η Cen, after pre-whitening for the 1.5562 c/d frequency. AOV spectra with a sampling of 0.0005 c/d were calculated over 3 d sliding averages. The frequency interval shown (abscissa) is 1.1–1.7 c/d. For both sub-images the AOV power (white is highest) was separately normalized to the respective mean power to facilitate comparison. The ordinates (in days) have arbitrary zero points. The two data strings have different starting dates but end at about the same time (cf. Fig. 4).
Current usage metrics show cumulative count of Article Views (full-text article views including HTML views, PDF and ePub downloads, according to the available data) and Abstracts Views on Vision4Press platform.
Data correspond to usage on the plateform after 2015. The current usage metrics is available 48-96 hours after online publication and is updated daily on week days.
Initial download of the metrics may take a while.