Fig. 5
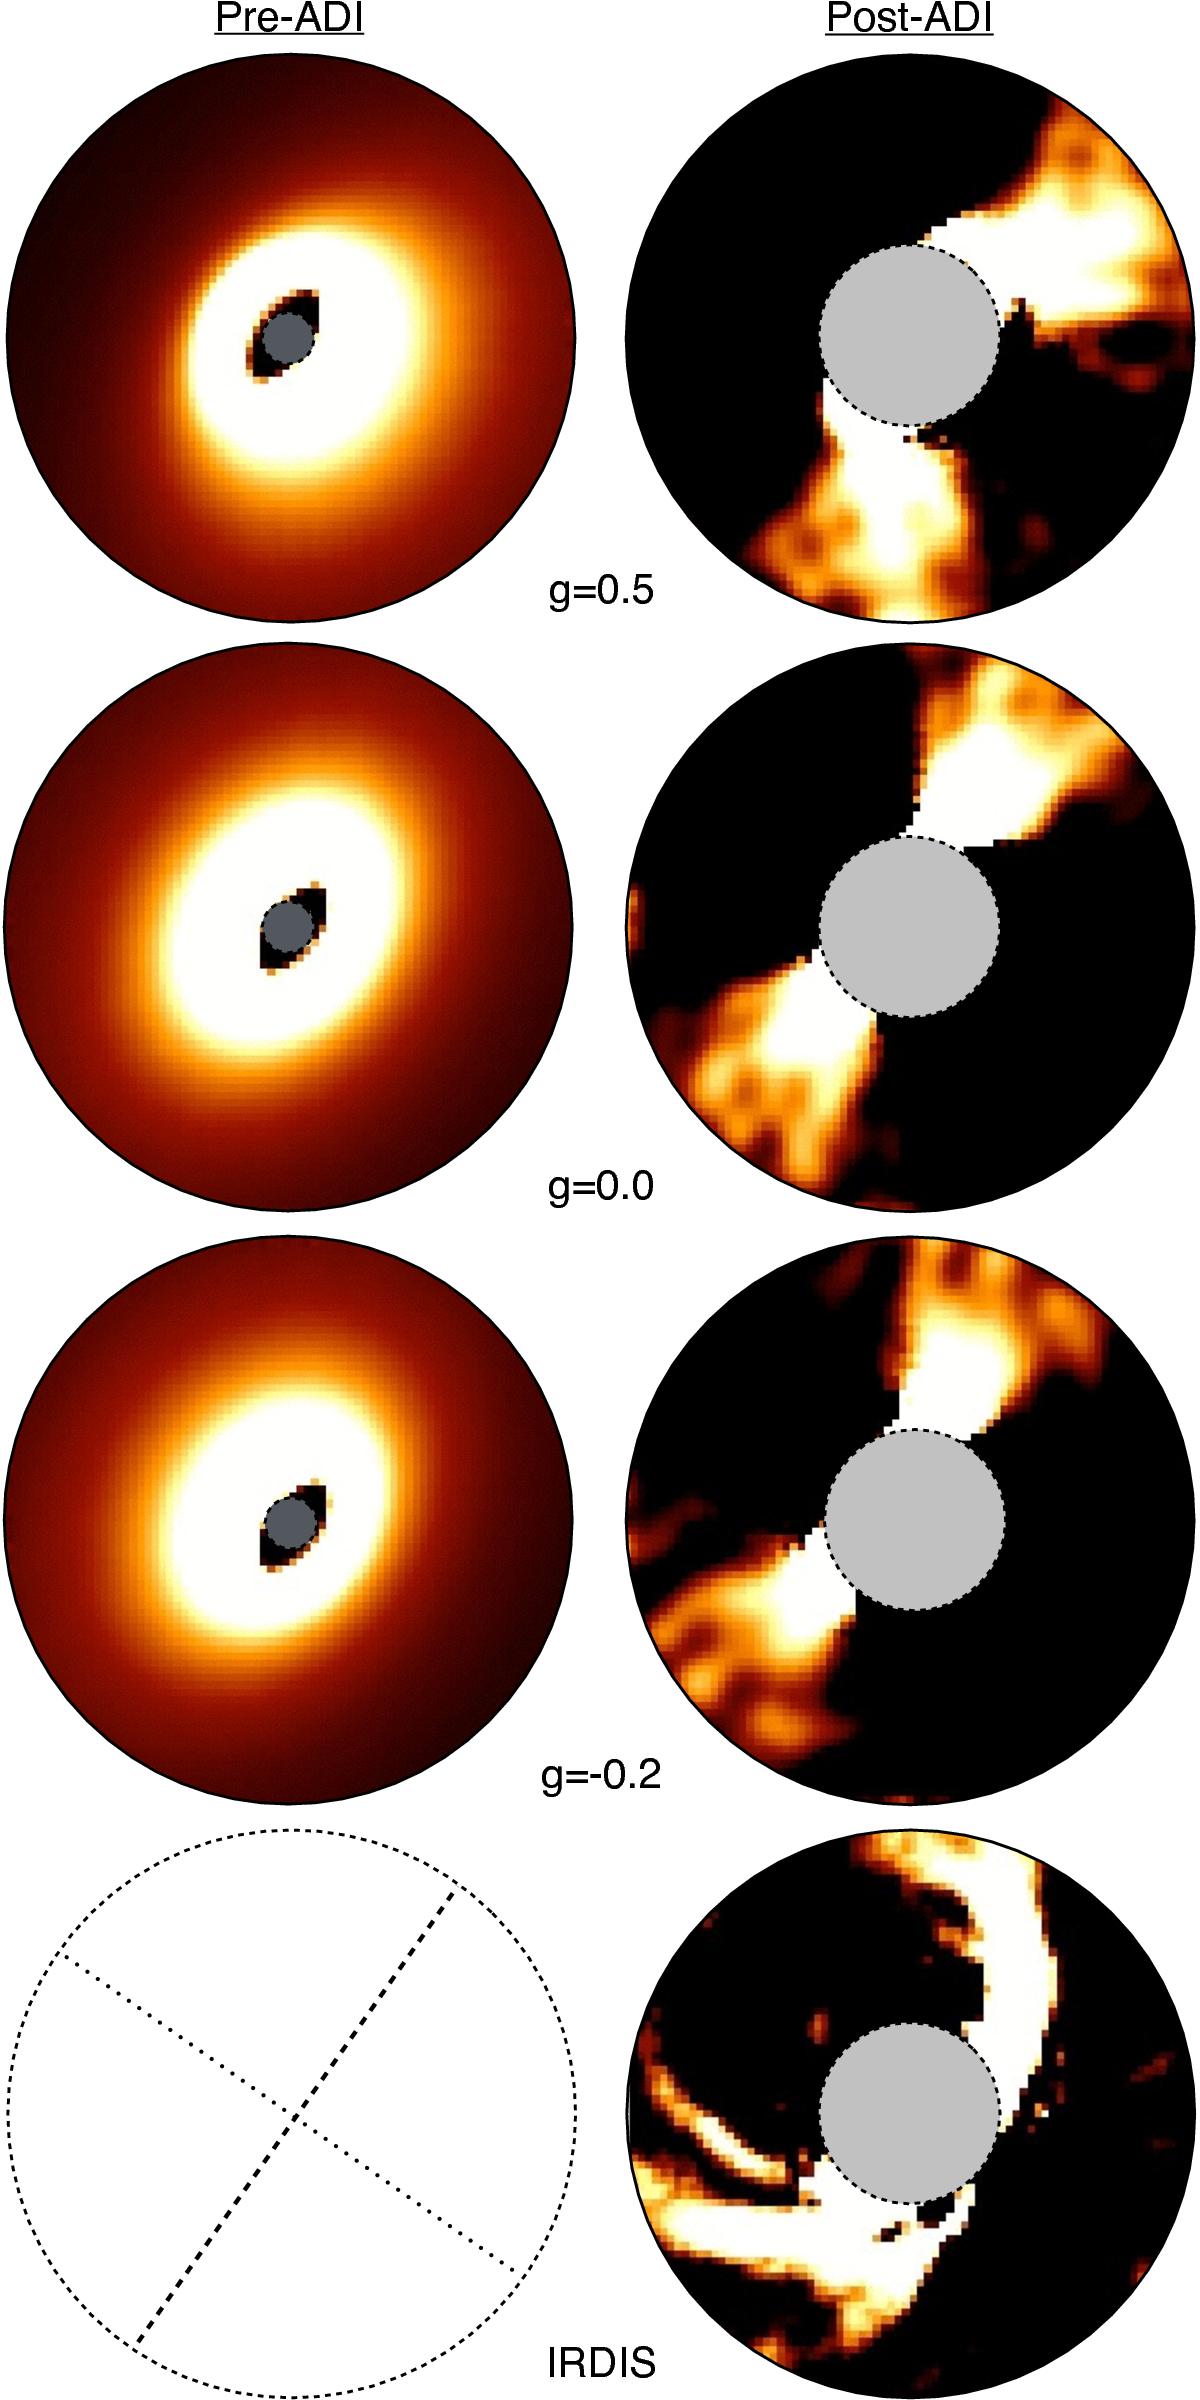
Impact of ADI processing on the scattered light distribution from an inclined disk. Left column: synthetic scattered light images in the H band obtained from the HD 100546 model by Mulders et al. (2013a). Right column: the same after the ADI analysis performed by pynpoint. The different rows are models with different asymmetry parameters g with the last one being the IRDIS observations. The flux scales are arbitrary.
Current usage metrics show cumulative count of Article Views (full-text article views including HTML views, PDF and ePub downloads, according to the available data) and Abstracts Views on Vision4Press platform.
Data correspond to usage on the plateform after 2015. The current usage metrics is available 48-96 hours after online publication and is updated daily on week days.
Initial download of the metrics may take a while.