Fig. 3
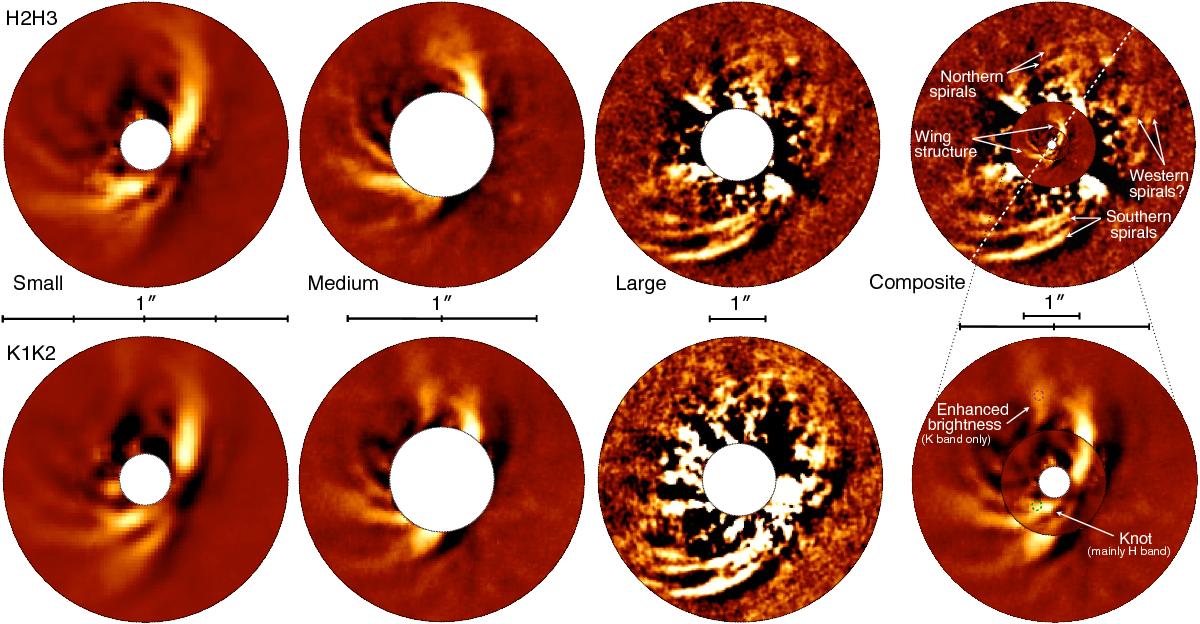
SPHERE/IRDIS imagery of HD 100546. Images in the top row are in the H2H3 band, in the bottom row in the K1K2 band. The first three columns are the images resulting from reductions with increasing inner and outer software masks (see Sect. 2.2). Images from the third column have been binned by 2 × 2 pixels. The color stretch scales by 20 from first to second column, and by 100 from second to third, while it is arbitrary between the wavebands. The fourth column is a composite image (H band the top one, H/K the small/large bottom one). The dashed line indicates the disk major axis, while the circles point to planet b from Quanz et al. (2015) and putative c from Currie et al. (2015). North is up, east is to the left.
Current usage metrics show cumulative count of Article Views (full-text article views including HTML views, PDF and ePub downloads, according to the available data) and Abstracts Views on Vision4Press platform.
Data correspond to usage on the plateform after 2015. The current usage metrics is available 48-96 hours after online publication and is updated daily on week days.
Initial download of the metrics may take a while.