Free Access
Fig. 5
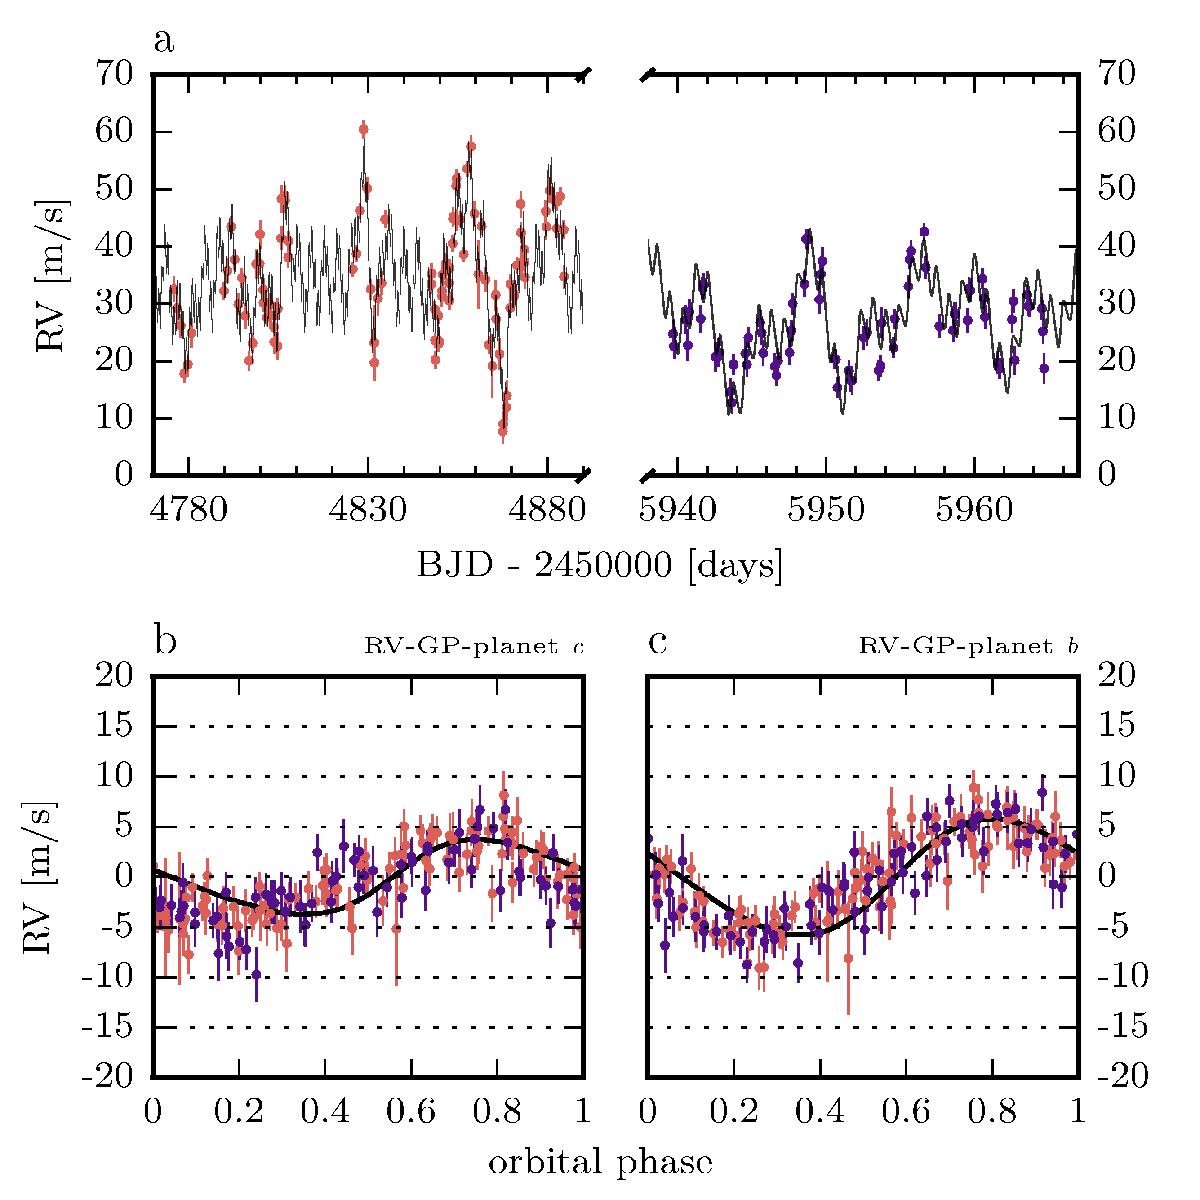
Panel a): RV measurements of CoRoT-7 from 2009 and 2012 and the two-planet best-fit model (black curve). Note the different scales in the abscissae on the left and right parts of the plot. Panels b) and c) show the phased RV curves after subtracting each planet signal and the GP.
Current usage metrics show cumulative count of Article Views (full-text article views including HTML views, PDF and ePub downloads, according to the available data) and Abstracts Views on Vision4Press platform.
Data correspond to usage on the plateform after 2015. The current usage metrics is available 48-96 hours after online publication and is updated daily on week days.
Initial download of the metrics may take a while.