Fig. 4
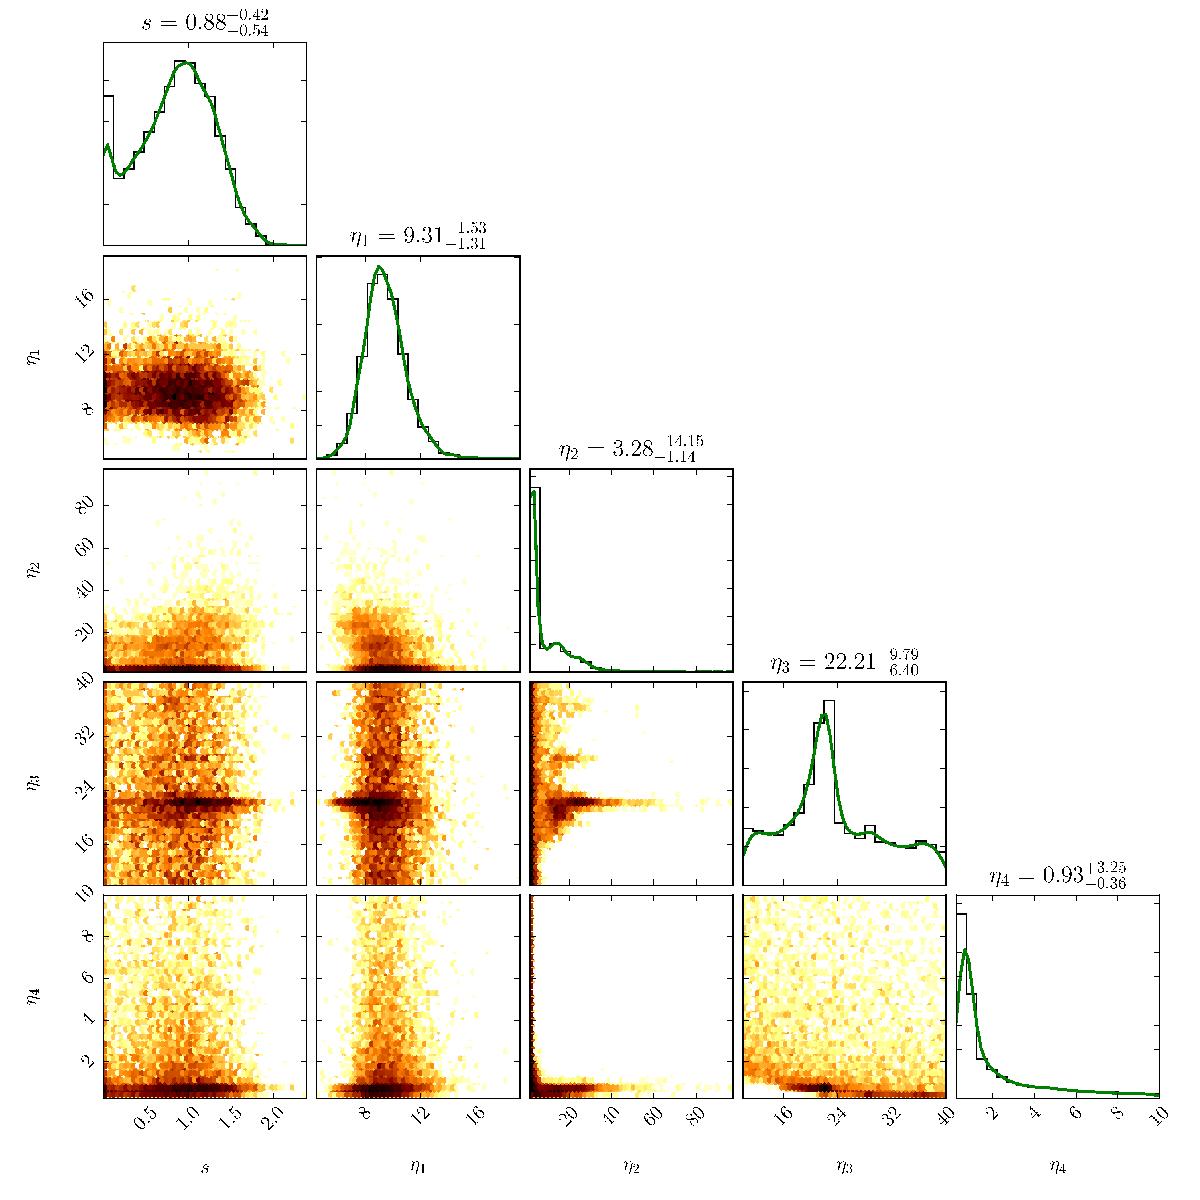
Marginalised 1D and 2D posterior distributions for the parameters of the GP and the extra white noise. The samples for all values of Np were combined. The titles above each column show the median of the posterior and the uncertainties calculated from the 16% and 84% quantiles. The solid lines are kernel density estimations of the marginal distributions.
Current usage metrics show cumulative count of Article Views (full-text article views including HTML views, PDF and ePub downloads, according to the available data) and Abstracts Views on Vision4Press platform.
Data correspond to usage on the plateform after 2015. The current usage metrics is available 48-96 hours after online publication and is updated daily on week days.
Initial download of the metrics may take a while.