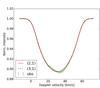
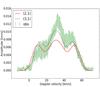
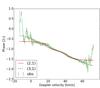
Fig. 7

Identification of the individual mode geometry for F1 studying line 1. The plots correspond to the normalized intensity of the studied spectral line (left), amplitude of the variation (middle), and phase (right). The observations are plotted with a green dotted line and the error bars are included in green as well. The two most suitable identifications are plotted with a dashed black line for (l, m) = (3, 1), which was obtained with a χ2 of 1.88, and a solid red line for (l, m) = (2, 1), which was obtained with a χ2 of 2.43.
Current usage metrics show cumulative count of Article Views (full-text article views including HTML views, PDF and ePub downloads, according to the available data) and Abstracts Views on Vision4Press platform.
Data correspond to usage on the plateform after 2015. The current usage metrics is available 48-96 hours after online publication and is updated daily on week days.
Initial download of the metrics may take a while.