Fig. 4
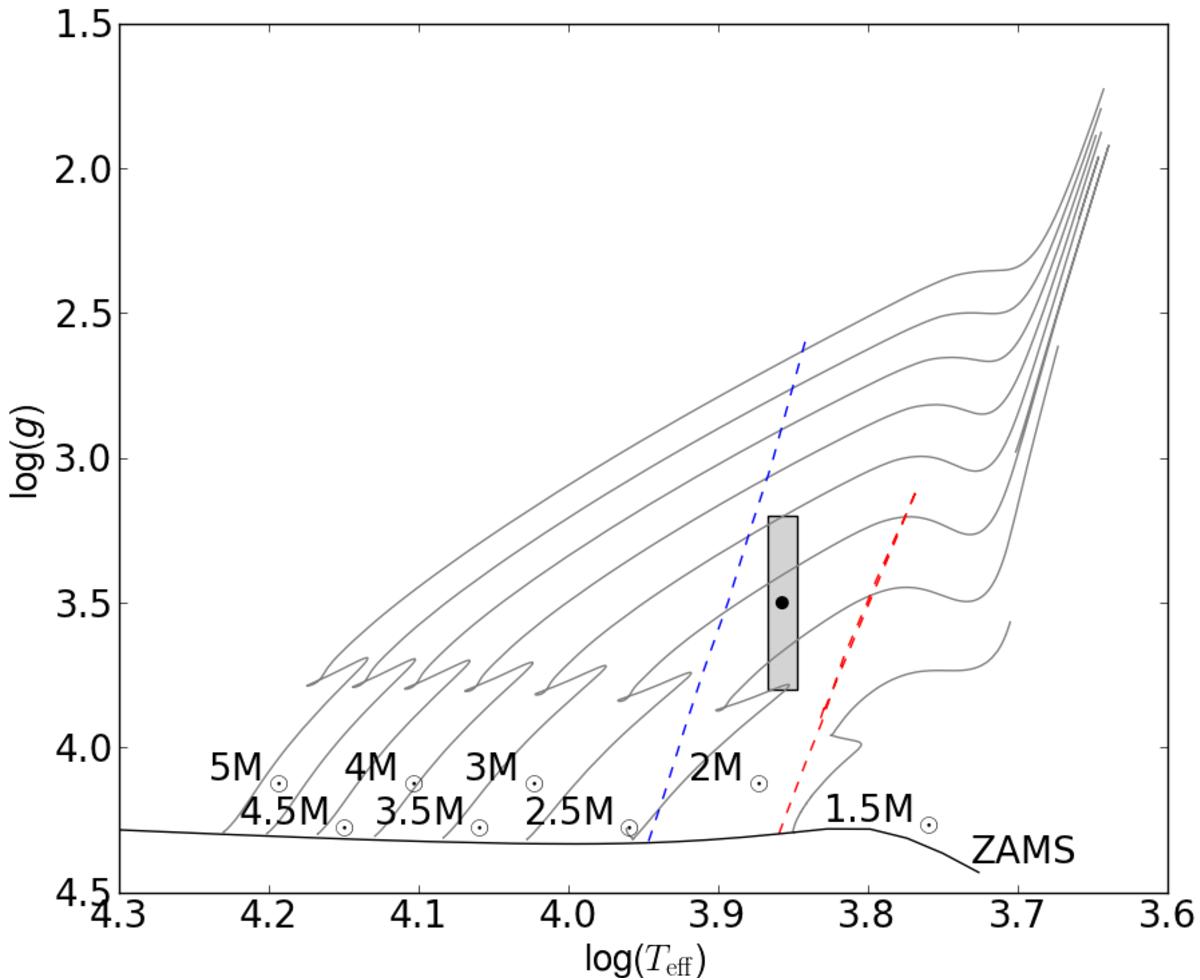
Position of HD 41641 (black dot) in a (log g–logTeff) diagram. The shaded box corresponds to the error bars obtained from the χ2 minimization. The ZAMS (black solid line), theoretical blue edge (blue dashed line), and empirical red edge (red dashed line) of the classical δ Sct instability strip were taken from Breger & Pamyatnykh (1998). Post-main-sequence evolutionary tracks (gray solid lines) are from Guenther & Brown (2004).
Current usage metrics show cumulative count of Article Views (full-text article views including HTML views, PDF and ePub downloads, according to the available data) and Abstracts Views on Vision4Press platform.
Data correspond to usage on the plateform after 2015. The current usage metrics is available 48-96 hours after online publication and is updated daily on week days.
Initial download of the metrics may take a while.