| Issue |
A&A
Volume 588, April 2016
|
|
|---|---|---|
| Article Number | A62 | |
| Number of page(s) | 9 | |
| Section | Planets and planetary systems | |
| DOI | https://doi.org/10.1051/0004-6361/201527869 | |
| Published online | 18 March 2016 | |
Tracking Advanced Planetary Systems (TAPAS) with HARPS-N
III. HD 5583 and BD+15 2375 – two cool giants with warm companions⋆,⋆⋆
1
Toruń Centre for Astronomy, Faculty of Physics, Astronomy and Applied
Informatics, Nicolaus Copernicus University in Toruń,
Grudziadzka 5,
87-100
Toruń,
Poland
e-mail:
This email address is being protected from spambots. You need JavaScript enabled to view it.
2
Departamento de Física Teórica, Universidad Autónoma de
Madrid, Cantoblanco,
28049
Madrid,
Spain
e-mail:
This email address is being protected from spambots. You need JavaScript enabled to view it.
3
Instituto de Astrofísica de Canarias, 38205, La Laguna, Tenerife, Spain
4
Departamento de Astrofísica, Universidad de La
Laguna, 38206, La
Laguna, Tenerife,
Spain
5
McDonald Observatory and Department of Astronomy, University of
Texas at Austin, 2515 Speedway,
Stop C1402, Austin,
TX
78712-1206,
USA
6
National Center for Supercomputing Applications, University of
Illinois, Urbana-Champaign, 1205 W
Clark St, MC-257, Urbana, IL
61801,
USA
7
Department of Astronomy and Astrophysics, Pennsylvania State
University, 525 Davey Laboratory, University Park, PA
16802,
USA
e-mail:
This email address is being protected from spambots. You need JavaScript enabled to view it.
8
Center for Exoplanets and Habitable Worlds, Pennsylvania State
University, 525 Davey Laboratory, University Park,
PA 16802,
USA
Received: 1 December 2015
Accepted: 19 January 2016
Abstract
Context. Evolved stars are crucial pieces for our understanding of the dependency of the planet formation mechanism on the stellar mass and for exploring the mechanism involved in star-planet interactions more deeply. Over the last ten years, we have monitored about 1000 evolved stars for radial velocity variations in the search for low-mass companions under the Penn State – Torun Centre for Astronomy Planet Search program with the Hobby-Eberly Telescope (HET). Selected prospective candidates that required higher RV precision measurements were followed with HARPS-N at the 3.6 m Telescopio Nazionale Galileo under the TAPAS project.
Aims. We aim to detect planetary systems around evolved stars to be able to build sound statistics on the frequency and intrinsic nature of these systems, and to deliver in-depth studies of selected planetary systems with evidence of star-planet interaction processes.
Methods. For HD 5583 we obtained 14 epochs of precise RV measurements that were collected over 2313 days with the HET, and 22 epochs of ultra-precise HARPS-N data collected over 976 days. For BD+15 2375 we collected 24 epochs of HET data over 3286 days and 25 epochs of HARPS-S data over 902 days.
Results. We report the discovery of two planetary mass objects that are orbiting two evolved red giant stars: HD 5583 has a msini = 5.78MJ companion at 0.529 AU in a nearly circular orbit (e = 0.076), the closest companion to a giant star detected with the RV technique, and BD+15 2735 that, with a msini = 1.06MJ, holds the record for the lightest planet orbiting an evolved star found so far (in a circular e = 0.001, 0.576 AU orbit). These are the third and fourth planets found within the TAPAS project, a HARPS-N monitoring of evolved planetary systems identified with the HET.
Key words: stars: evolution / planets and satellites: individual: HD 5583 / planet-star interactions / stars: late-type / planets and satellites: individual: BD+15 2375
Based on observations obtained with the Hobby-Eberly Telescope, which is a joint project of the University of Texas at Austin, the Pennsylvania State University, Stanford University, Ludwig-Maximilians-Universität München, and Georg-August-Universität Göttingen.
Based on observations made with the Italian Telescopio Nazionale Galileo (TNG) operated on the island of La Palma by the Fundación Galileo Galilei of the INAF (Istituto Nazionale di Astrofisica) at the Spanish Observatorio del Roque de los Muchachos of the Instituto de Astrofísica de Canarias.
© ESO, 2016
1. Introduction
The discovery of the first exoplanet orbiting a solar-type star (Mayor & Queloz 1995) unveiled a completely unexpected population of massive planets that were orbiting within 1 AU of their stars (the so-called hot Jupiters). Currently, we know that about 0.5% of stars hosts these kind of objects (Wright et al. 2012) and the class is limited to gas planets within 0.1 AU or, roughly, with orbital periods of up to ten days. The origin of those planets is still being debated, as prevalent planet formation theories (see Pollack et al. 1996; Boss 1997) do not allow for in situ formation of such objects. Two possible mechanisms have been proposed to explain the orbital distribution of hot Jupiters: i) early proto-planetary disc migration (Lin et al. 1996); and ii) dynamical interaction with a third massive object in a multiple system that leads to a smaller, eccentric, orbit that circularises through tidal dissipation (Rasio & Ford 1996). Of note is the recent estimate by Ngo et al. (2015) of the large fraction of hot Jupiters (72% ± 16%) that are part of multi-planet and/or multi-star systems. An intriguing class of objects in this context are the so-called warm-Jupiters, gas planets at 0.1 to 0.5 AU, with orbital periods of ten to 100 days, as transition objects that possibly feed the hot-Jupiter population (see Howard et al. 2012).
The growing statistics of hot and of warm Jupiters mainly comes from transit planet searches that deliver the population of low-mass companions to main-sequence stars. In the case of more evolved stars, like subgiants and giants, the fact that close companions are very rare was already noted by by Johnson et al. (2007), Burkert & Ida (2007), Sato et al. (2008). In fact, no hot Jupiter is known around a giant and only very few warm Jupiters orbit subgiants (see Lillo-Box et al. 2014; Johnson et al. 2010). One possible explanation is that low-mass close companions to evolved stars are ingested by their hosts owing to tidal interactions (Sato et al. 2008; Villaver & Livio 2009). There is, however, an alternative explanation and it is related to the short depletion timescales of gas in the proto-planetary disks expected in massive stars (Burkert & Ida 2007; Currie 2009). We note, however, that evolved stars are not necessarily intermediate-mass stars and these terms should not be used interchangeably. Furthermore, early gas-disk depletion will only work as an explanation for the lack of close, low-mass companions to evolved stars if the bulk of the population of hot Jupiters builds via early proto-planetary disk migration and all evolved stars have massive progenitors.
An additional complication to the observational interpretation of the data comes from the fact that in the case of the evolved giants past the red giant branch (RGB)-tip, the planetary systems may not only be affected by a previous engulfment process (Villaver & Livio 2007; Kunitomo et al. 2011) but also, in some cases, experience RGB-tip planetary orbit-shrinking (Villaver & Livio 2009; Villaver et al. 2014) and, thus, possibly rebuild the warm-Jupiter population. Furthermore, stellar mass-loss can trigger delayed instability in multiple planetary systems (Mustill et al. 2014).
Statistical considerations, including both short- and long-period systems around those stars, are fundamental for determining the actual process responsible for the lack of hot Jupiters around evolved stars since we cannot exclude the fact that the observed distribution might be due to a selection that resulted from degradation of effective radial velocity (RV) precision by stellar activity (Niedzielski et al. 2016). Building meaningful statistics of those objects is the aim of several observing projects, such as the McDonald Observatory Planet Search (Cochran & Hatzes 1993; Hatzes & Cochran 1993), the Okayama Planet Search (Sato et al. 2003), the Tautenberg Planet Search (Hatzes et al. 2005), the Lick K-giant Survey (Frink et al. 2002), the ESO Ferros planet search (Setiawan et al. 2003a,b), Retired A Stars and Their Companions (Johnson et al. 2007), the Coralie & HARPS search (Lovis & Mayor 2007), the Boyunsen Planet Search (Lee et al. 2011), our own Pennsylvania-Toruń Planet Search (PTPS, Niedzielski et al. 2007; Niedzielski & Wolszczan 2008), and several others.
Properties of planetary systems around evolved hosts have been explored in several papers already. The planet-metallicity correlation seems to be well established for the massive evolved stars (Maldonado et al. 2013; Reffert et al. 2015; Jofré et al. 2015) but doubtful for the lower mass stars (Maldonado et al. 2013) or planet candidates samples (Reffert et al. 2015). And while several studies so far have expected differences in the orbital distribution of planets for massive stars, this is mostly due to a faster depletion of the gas in the proto-planetary disk (see Kennedy & Kenyon 2009; Burkert & Ida 2007; Currie 2009; Ribas et al. 2015). Observationally, it is very difficult to disentangle the primordial differences from the evolutionary ones, which should also leave an imprint in the orbital distribution of the evolved systems (see Villaver et al. 2014).
The relation between the planetary properties and those of the central stars offer important clues to our current understanding of planet formation and guide the theoretical modelling. In the case of giant stars, the discovery of new planetary mass objects is of special relevance for several reasons. New objects help to populate the numbers needed to build better statistics of planets around evolved stars. Many of these planets orbit stars with masses M> 1.2−1.5 M⊙ and, since a clear dependency between planet formation and the stellar mass has not been found yet, any new planet found around a massive star adds valuable information to our understanding. In this regard, knowing the evolutionary status of the star is fundamental, given that the primordial properties of these planet-star systems can be somehow erased as the star leaves the main sequence (Villaver & Livio 2007, 2009). Furthermore, evolved red giants require precise evolution history studies for a proper interpretation of the observed properties of their planetary systems.
In this paper, the third in the series (after Niedzielski et al. 2015a, hereafter Paper I, and Adamów et al. 2015), we present two more close-orbit companions to red giants from our HARPS-N follow-up of selected PTPS targets under the TAPAS project. We discuss their future in terms of how stellar evolution is expected to change their orbital properties, and explore their past by contextualising these two systems into the general population of warm Jupiter planets that have been observed around main-sequence stars.
The paper is organised as follows: in Sect. 2 we present the observations obtained for our targets and outline the reduction and measurement procedures; Sect. 3 shows the results of the Keplerian data modelling; in Sect. 4 we extensively discuss the influence of the stellar activity on the RV variation measurements; and in Sect. 5, we discuss the results of our analysis and present the conclusions of this work.
2. Targets, observations and the RV data
The spectroscopic observations presented in this paper were made with the 9.2 Hobby-Eberly Telescope (HET, Ramsey et al. 1998) and its High-Resolution Spectrograph (HRS, Tull 1998) in the queue scheduled mode (Shetrone et al. 2007), and with the 3.58 m Telescopio Nazionale Galileo (TNG) and its High Accuracy Radial velocity Planet Searcher in the northern hemisphere (HARPS-N, Cosentino et al. 2012).
Both HD 5583 and BD+15 2375 belong to a sample of about 300 planetary or brown dwarf (BD) candidates identified in the complete sample of over 1000 stars that have been observed with HET and HRS since 2004 within PennState – Toruń Centre for Astronomy Planet Search (PTPS, Niedzielski et al. 2007, 2015b; Niedzielski & Wolszczan 2008) and selected for a more intense precise RV follow-up. The programme Tracking Advanced Planetary Systems (TAPAS) with HARPS-N is the result of an intensification in the monitoring of a selected number of about 100 PTPS-identified targets, i.e. those with potentially multiple and/or low-mass companions, with expected p-mode oscillations of a few m s-1, and systems with evidence of recent or future star-planet interactions (Li-rich giants, low-orbit companions, etc.).
HD 5583 and BD+15 2375 are giant stars selected as a TAPAS targets because the available HET observations pointed to relatively short orbital periods, which makes these stars promising targets for star-planet interaction studies.
2.1. Observations
The HET spectra were gathered with the HRS, which is fed with a 2 arcsec fiber, working in the R = 60 000 mode with a gas cell (I2) inserted into the optical path. The configuration and observing procedure employed in our programme were, in practice, identical to those described by Cochran et al. (2004). Details of our survey, the observing procedure, and data analysis have been described in detail elsewhere (Niedzielski et al. 2007, 2015b; Nowak et al. 2013). We use a combined gas-cell (Marcy & Butler 1992; Butler et al. 1996), and cross-correlation (Queloz 1995; Pepe et al. 2002) method for precise RV and spectral line bisector (BS) measurements, respectively. The implementation of this technique to our data is described in Nowak (2012) and Nowak et al. (2013).
The HARPS-N, a near-twin of the HARPS instrument that is mounted at the ESO 3.6 m telescope in La Silla (Mayor et al. 2003), is an echelle spectrograph covering the visible wavelength range between 383 nm and 693 nm with a resolving power of R ~ 115 000. Radial velocity measurements and their uncertainties, as well as BS, were obtained with the standard user pipeline, which is based on the weighted CCF method (Fellgett 1955; Griffin 1967; Baranne et al. 1979, 1996; Queloz 1995; Pepe et al. 2002). To obtain the highest precision RV, we used the simultaneous Th-Ar calibration mode of the spectrograph. The RVs were obtained with the K5 cross-correlation mask. More details on the instrumental configuration were presented in Paper I.
Summary of the available data on HD 5583.
Summary of the available data on BD+15 2375.
2.2. Stars and their parameters
The star HD 5583 (BD+34 154, TYC 2285-00548-1) is a V = 7.60 ± 0.01 and B = 8.54 ± 0.02 (Høg et al. 2000) star in Andromeda with no parallax available. It belongs to the PTPS Giants and Subgiants sample and has been included in PTPS since May 2006. Its atmospheric parameters were determined with the purely spectroscopic method of Takeda et al. (2005a,b) by Niedzielski et al. (2016).
The star BD+15 2375 (GSC 00870-00204, TYC 0870-00204-1) is a V = 10.31 ± 0.023 and B − V = 1.05 ± 0.008 (Haggkvist & Oja 1973) star in Leo with no parallax available. The star belongs to the PTPS Red Giant Clump sample and has been observed within PTPS since March 2004. Its atmospheric parameters were estimated using the method of Takeda et al. (2005a,b) by Zieliński et al. (2012).
Based on abundance calculations through using the Spectroscopy Made Easy package (Valenti & Piskunov 1996) which models of 27 spectral lines for six elements, (Adamów 2014b,a) we obtained vrotsini⋆ and found no anomalies in the lithium abundances for none.
Stellar mass, luminosity, age, and radii for HD 5583 and BD+15 2375 were estimated on the basis of spectroscopically determined atmospheric parameters in Niedzielski et al. (2016) and Adamczyk et al. (2016), respectively.The amplitude and period of p-mode oscillations (Vosc, Posc) were estimated using the scaling relation by Kjeldsen & Bedding (1995). Using the rotational velocities from Adamów (2014b) and stellar radii derived in Adamczyk et al. (2016), we obtained estimates of maximum rotation periods, Prot.
A summary of all the available data for HD 5583 and BD+15 2735 is given in Tables 1 and 2, respectively.
2.3. Radial velocities and spectral line bisectors
The star HD 5583 was observed over 3225 days between Modified Julian day MJD = 54 013 and 57 238. We obtained 14 epochs of HET HRS RV and BS for HD 5583 over 2313 days between MJD = 54 013 and 56 326 and 22 epochs of TNG HARPS-N RV and BS over 976 days between MJD = 56 261 and 57 238.
The HET RV data (Table A.1) show a peak-to-peak amplitude of 524m s-1 and average uncertainty of 7m s-1, while the BS varies by 100m s-1 with average uncertainty of 19m s-1. The Parsons correlation coefficient between RV and BS is –0.21. The obvious lack of correlations justifies the interpretation of RV variations as being due to Keplerian motion.
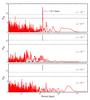 |
Fig. 1 Lomb Scargle priodograms for HD 5583, top to bottom: combined RV data, Super WASP photometry and RV residua. False alarm probability levels of p = 0.01 and 0.001 are marked with horizontal lines. |
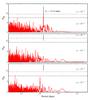 |
Fig. 2 Lomb Scargle priodograms for BD+15 2735, top to bottom: combined RV data, ASAS photometry and RV residua. False alarm probability levels of p = 0.01 and 0.001 are marked with horizontal lines. |
HARPS-N RV for this star (Table A.2) show an amplitude of 499m s-1 and average uncertainty of 1.7m s-1. The BS varies by 41m s-1. The correlations coefficient between RV and BS of only –0.13 justifies again the interpretation of the observed RV variations as being due to Keplerian motion.
We observed BD+15 2375 over 4103 days between MJD = 53 093 and 57 196. We gathered 24 epochs of HET HRS RV data over 3286 days between MJD = 53 093 and 56 379 of which two, apparent outliers were rejected. In addition we collected 25 epochs of TNG HARPS-N RV over 902 days between 56294 and 57196.
The available HET HRS RV data (Table A.3) show an amplitude of 93m s-1 and average uncertainty of 7m s-1, while the BS varies by 99m s-1 with average uncertainty of 17m s-1. The correlation coefficient between RV and BS is 0.60, just above the critical value of 0.54, so the relation between RV and BS requires more detailed examination (see Sect. 4).
The HARPS-N RV data collected for this star (Table A.4) show an amplitude of 112m s-1 and average uncertainty of 2.4m s-1. The BS varies by 40m s-1 and shows no correlation with RV (r = 0.22), which suggests a Keplerian character of the observed RV variations. We therefore assume that, in both cases, the observed RV variations are Keplerian, at least in the first approximation, but we will come back to this issue in Sect. 4.
3. Keplerian analysis
Keplerian orbital parameters were derived using a hybrid approach (see Goździewski et al. 2003, 2007; Goździewski & Migaszewski 2006), in which the PIKAIA-based, global genetic algorithm (GA; Charbonneau 1995) was combined with a faster and more precise local method, namely MPFit algorithm (Markwardt 2009), to find the best-fit Keplerian orbit delivered by RVLIN (Wright & Howard 2009) and this was modified to allow the stellar jitter to be fitted as a free parameter (Ford & Gregory 2007; Johnson et al. 2011). The clearly visible periodic signals found in the RV data with the Lomb-Scargle (LS) periodogram (Lomb 1976; Scargle 1982; Press et al. 1992), see Figs. 1 and 2, were used as first approximations of orbital periods.
The RV bootstrapping method (Murdoch et al. 1993; Kuerster et al. 1997; Marcy et al. 2005; Wright et al. 2007) was employed to assess the uncertainties of the best-fit orbital parameters, which where defined as the width of the resulting distribution of 106 trials of scrambled data between the 15.87th and 84.13th percentile. The false alarm probability (FAP) of the final orbital solutions was derived by repeating the whole hybrid analysis on 105 sets of scrambled data. The results of Keplerian analysis are presented in Table 3 and in Figs. 3 and 4.
We note that, in the case of BD+15 2735, the resulting RV jitter is consistent with our estimates while, in the case of HD 5583, it is ~4 times larger than our estimate, based on the empirical scaling relations of Kjeldsen & Bedding (1995).
Keplerian orbital parameters of HD 5583 b and BD+15 2735 b.
4. Activity
Giants are known to be variable stars (Payne-Gaposchkin 1954; Walker et al. 1989). Moreover, both stars show Keplerian motion periods that are shorter than the maximum rotation periods, which were estimated from the projected rotation velocity and radii. Also, in the case of BD+15 2735, there is a weak correlation between RV and BS for HET/HRS data. We therefore need to discuss the available data in the context of stellar activity and its possible influence on the observed RV variations.
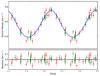 |
Fig. 3 Keplerian orbital fit for HD 5583 b. In red HET HRS data, in green TNG HARPS-N data. Jitter is added to RV uncertainties. |
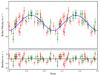 |
Fig. 4 Keplerian orbital fit for BD+15 2735 b. In red HET HRS data, in green TNG HARPS-N data. Jitter is added to RV uncertainties. |
4.1. Photometry
HD 5583 was observed within Super WASP (Pollacco et al. 2006) over 1243 days between JD 2 453 209.6 to 2 454 452.5, which is partly contemporaneous with our HET observations. The 4367 epochs of photometric data show an average brightness of 7.79 ± 0.04 mag and contain no detectable periodic signal (Fig. 1). We note, however, that the uncertainty in the Super WASP data is much larger than expected for such a bright star and it is most likely of instrumental nature; the star is simply too bright.
For BD+15 2375, two sets of photometric data are available: 367 epochs of ASAS (Pojmanski 1997) observations and 83 epochs of NSVS data (Woźniak et al. 2004). The ASAS data were collected over 2400 days between HJD 2 452 624.9 and 2 455 025.5 and are partly contemporaneous with our HET data. These data show a mean brightness of 10.294 ± 0.018 mag. The NSVS data were collected over 336 days between JD 2 451 274.8 and 2 451 611.9, i.e. long before our observations started. The data show mean brightness of 10.189 ± 0.015 mag. In both cases, the uncertainties are consistent with the stellar brightness and the photometric data contain no detectable periodic signal (Fig. 2).
The available photometric data exclude pulsations as a possible source of observed RV variations of our programme stars. The lack of observable periodic photometric variations also excludes the stellar spot scenario to explain the RV variations. Taking a very conservative approach, we may however, use the estimated uncertainty in the available photometric data sets as a proxy of the spot size and estimate what would be the maximum contribution that is due to a hypothetical spot on the RV and BS signal.
Following the approach of Hatzes (2002), we can estimate that, in the case of HD 5583, the maximum peak-to-peak RV variations that are due to such a hypothetical spot might reach 225m s-1 and the BS – 36m s-1. The observed RV signal in both HET HRS and TNG HARPS-N data is over twice that much, hence a spot interpretation is unlikely.
In the case of BD+15 2735, the maximum RV variations that result from a spot might reach 126m s-1 and BS – 17m s-1 according to Hatzes (2002). These values are comparable to the observed ones.
4.2. Spectral line bisectors
The HET and HRS and HARPS-N BS are not directly comparable because they were calculated not only from different instruments, but also from different sets of spectral lines. The HET bisecor span was calculated from a cross-correlation function that was constructed from spectra cleaned from the I2 lines and correlated with a syntetic K2 spectrum. It was defined as a difference between CCF profile mean velocities at 0.1–0.25 and 0.65–0.80 of the line depth (Nowak 2012). The HARPS-N CCF line bisectors were calculated as a mean velocity difference between 0.1–0.4 and 0.55–0.9 of the line depth (Queloz et al. 2001). Thus, we need to consider them separately.
For HD 5583, HET/HRS BS shows an amplitude of 100m s-1 with average uncertainty of 19m s-1, while for HARPS-N the amplitude is 41m s-1. These variations are comparable, or larger than those that are due to a hypothetical spot. They are, however, 5–12 times smaller than the observed RV variations and show no correlation with RV. Any significant contribution to RV from BS variations is therefore unlikely.
HET/HRS BS data for BD+15 2375 show an amplitude of 99m s-1 and average uncertainty of 17m s-1. The HARPS-N BS vary by 40m s-1. These variations are larger than those produced by a hypothetical spot. The amplitude of BS variations is comparable (HET data) or only ~2 times lower (TNG) than the observed RV variations.
We note that HET RVs show larger amplitude than that of HARPS-N. Also HET BSs, although not directly comparable to HARPS-N ones, show ~3 times larger variations. The amplitude of BS variations is roughly the same as in RV. Also intriguing is the RV-BS correlation in these data. Given the relatively low number of observations it may very well prove spurious, especially since the most recent HARPS-N data show lower RV and BS amplitudes and no RV-BS correlation.
It cannot, therefore, be excluded that the HET data were gathered during a period of increased activity of BD+15 2735 – a period of enlarged spot-moving with the rotating star, which resulted in the increased RV signal and RV-BS correlation. HARPS-N data, showing a periodic RV signal and no RV-BS correlation, proves instead that only a fraction, if any at all, of HET RV was due to activity and that the Keplerian signal dominates. The period of the activity cycle is not known, but the proposed scenario seems to be additionally supported by existing photometry data that is contemporaneous to our HET observations, which show larger uncertainties than older NSVS data. This is somewhat similar to the periodic activity detected in GJ 581, as discussed in Robertson et al. (2014).
4.3. Ca H and K lines
The Ca II H, and K line profiles are widely accepted as stellar activity indicators (see Noyes et al. 1984; Duncan et al. 1991) and if the reversal profile, typical for active stars (Eberhard & Schwarzschild 1913) is present, chromospheric activity can be deduced.
Unfortunately, neither the Ca II H and K lines, nor the infrared Ca II triplet lines at 849.8–854.2 nm are available in HET and HRS spectra, but the Ca II H and K lines are present in the TNG HARPS-N spectra. The signal-to-noise of our red giants in that spectral range is low, but we found no trace of reversal. To quantify the observations, we calculated an instrumental  index according to the prescription of Duncan et al. (1991) for HARPS-N data. For HD 5583, we obtained a value of 0.17 with a standard deviation of 0.08, which is a typical value for non-active stars. The for this star shows no statistically significant correlation with the RV (r = −0.22). Also in the case of BD+15 2735 no trace of profile reversal was found,
  and no correlation with the RV (r = −0.01) exists.
We conclude that Ca II H and K line profiles analysis thus reveals that, over the period covered by TNG observations, both giants are quite inactive and there is no trace of influence of activity upon the observed RV variations.
4.4. Hα
Another activity indicator that we can use for the HET and HRS spectra is the Hα (656.2808 nm) line, which in red giants is quite weak. We measured the Hα index (IHα) following the procedure described in detail in Maciejewski et al. (2013), which is based on the approach presented by Gomes da Silva et al. (2012) and Robertson et al. (2013, and references therein). We analyse the Hα index measurements from HET and TNG spectra instruments together, applying the RV offset that was determined in Keplerian analysis.
In the case of HD 5583, the IHα has a mean value of 0.034 and varies by 0.003, or 10.0%. These variations are not correlated with the RV (r = 0.12). The control line (FeI 6593.878 Å) index has a mean value of 0.012, varies by 0.001 or 9.0%, and is not correlated with RV (r = −0.13). The variations in both indexes are correlated (r = 0.55), which proves that the observed Hα line-profile variations are mostly due to instrumental effects and do not carry information on stellar variability in the Hα line.
BD+15 2735 has a mean IHα value of 0.035 and varies by 0.004 or 12.6%. It shows no correlation with RV (r = −0.23). At the same time the control line index has a mean value of 0.011, varies by 0.001 or 10.3%, and shows no correlation with RV (r = −0.14). These variations again show correlation (r = 0.52), which proves the instrumental nature of the observed Hα line-profile variations. We may therefore conclude that the analysis of IHα index based on HET/HRS data excludes significant levels of activity in both stars.
5. Discussion
We presented two giants with RV variations that, without compelling evidence for them being caused by stellar activity, we interpret as Keplerian motion, which is due to low-mass companions. The giant star HD 5583 has a minimum mass 5.78MJ companion in a 0.529 AU, nearly circular (e = 0.076) orbit, while the star BD+15 2735 has a minimum mass 1.061MJ companion in a 0.576 AU, nearly circular (e = 0.01) orbit. Assuming an average value of sini, both these companions stay within the planetary-mass range.
HD 5583 b has a mass of a rather typical gas giant planet, but its nearly circular a = 0.529 AU orbit is the tightest among solar-type (M< 1.2 M⊙) evolved stars that have been detected with the RV technique so far. It can be only compared to our own BD+15 2940 b (Nowak et al. 2013) at 0.539 AU or HD 32518 b at 0.59 AU (Döllinger et al. 2009).
BD+15 2735 b is a very rare Jupiter-mass companion to an evolved star. Actually, it is the lightest planet detected with the RV technique. Only two other similar planets are known, both from PTPS: mpsini = 1.16MJ BD +48 738b (Gettel et al. 2012; Niedzielski et al. 2016) and mpsini = 1.17MJ BD+15 2940 b (Nowak et al. 2013; Niedzielski et al. 2016).
In Fig. 5, evolutionary tracks for both stars are given and, if their inferred location in the HR diagram is correct, both stars are evolving up the RGB. From their stellar parameters, we estimate that their current orbits will lead to planet engulfment in 82 and 89 mln years, respectively (Villaver & Livio 2009; Villaver et al. 2014). This is the expected fate of most planets known so far. Both planets are within 0.6 AU and thus orbit at the very edge of the planet-avoidance zone around evolved stars.
To put the newly discovered planets in perspective, in Fig. 6 we show the orbital distribution of known planets, separated by the evolutionary status of the star, using as a proxy the stellar log g value. This figure illustrates well how efficient our project has been in detecting planetary-mass companions to evolved stars prone to tidal interactions with their hosts in the near future.
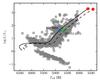 |
Fig. 5 Hertzsprung-Russell diagram for the complete PTPS sample with HD 5583 and BD+15 2735 and their evolutionary tracks. We show the stage when stellar radius reaches current planetary orbits in red. |
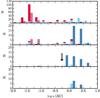 |
Fig. 6 Semi-major axis distributions for (top to bottom) dwarfs (here log g = 4.5 ± 0.5), subgiants (here log g = 3.5 ± 0.5), giants (here log g = 2.5 ± 0.5) and bright giants (here log g = 1.5 ± 0.5). In blue: RV planets only; in red: all other technique planets, including Kepler. In every 0.25 dex range, two bars are presented, left for hosts of ≤ 1.2 M/M⊙, and right > 1.2 M/M⊙. Planets with very extended orbits are omitted for clarity. The positions of the two planets presented in this paper are indicated by arrows. |
We note, in passing, that the RV jitter of HD 5583 is 3–4 times higher than expected for a star of this mass and luminosity. Its mass, although uncertain when estimated by means of Bayesian analysis, is not expected to be much different from the current estimate. It is thus possible that the luminosity of this object is underestimated by such a factor and that the star is actually a horizontal branch object already. If that is the case, this planet might have survived the RGB evolution of its host either by surviving engulfment on the envelope or having its orbital distance decreased through the mechanism that was identified in Villaver & Livio (2009). Then HD 5583 b would be one of very few companions to survive the evolution of its host (Niedzielski et al. 2015b).
Acknowledgments
We thank the HET and TNG resident astronomers and telescope operators for support. A.N., MoA, G.N., B.D., and MiA were supported by the Polish National Science Centre Grant UMO-2012/07/B/ST9/04415. MoA also acknowledges the Mobility+III fellowship from the Polish Ministry of Science and Higher Education. K.K. was funded in part by the Gordon and Betty Moore Foundation’s Data-Driven Discovery Initiative through Grant GBMF4561. This research was supported in part by PL-Grid Infrastructure. E.V. work was supported by the Spanish Ministerio de Ciencia e Innovacion (MICINN), Plan Nacional de Astronomia y Astrofisica, under Grant AYA2013-45347P. A.W. was supported by the NASA Grant NNX09AB36G. The HET is a joint project of the University of Texas at Austin, the Pennsylvania State University, Stanford University, Ludwig-Maximilians-Universität München, and Georg-August-Universität Göttingen. The HET is named in honour of its principal benefactors, William P. Hobby and Robert E. Eberly. The Center for Exoplanets and Habitable Worlds is supported by the Pennsylvania State University, the Eberly College of Science, and the Pennsylvania Space Grant Consortium. This research has made use of the SIMBAD database, operated at CDS (Strasbourg, France) and NASA’s Astrophysics Data System Bibliographic Services. This research has made use of the Exoplanet Orbit Database and the Exoplanet Data Explorer at http://exoplanets.org.
References
- Adamczyk, M., Deka-Szymankiewicz, B., & Niedzielski, A. 2016, A&A, 587, A119 [NASA ADS] [CrossRef] [EDP Sciences] [Google Scholar]
- Adamów, M. 2014a, Ph.D. Thesis, UMK Toruń [Google Scholar]
- Adamów, M., Niedzielski, A., Villaver, E., Wolszczan, A., & Nowak, G. 2014b, A&A, 569, A55 [NASA ADS] [CrossRef] [EDP Sciences] [Google Scholar]
- Adamów, M. M., Niedzielski, A., Villaver, E., et al. 2015, A&A, 581, A94 [NASA ADS] [CrossRef] [EDP Sciences] [Google Scholar]
- Baranne, A., Mayor, M., & Poncet, J. L. 1979, Vistas Astron., 23, 279 [NASA ADS] [CrossRef] [Google Scholar]
- Baranne, A., Queloz, D., Mayor, M., et al. 1996, A&AS, 119, 373 [NASA ADS] [CrossRef] [EDP Sciences] [Google Scholar]
- Boss, A. P. 1997, Science, 276, 1836 [NASA ADS] [CrossRef] [Google Scholar]
- Burkert, A., & Ida, S. 2007, ApJ, 660, 845 [NASA ADS] [CrossRef] [Google Scholar]
- Butler, R. P., Marcy, G. W., Williams, E., et al. 1996, PASP, 108, 500 [NASA ADS] [CrossRef] [Google Scholar]
- Charbonneau, P. 1995, ApJS, 101, 309 [NASA ADS] [CrossRef] [Google Scholar]
- Cochran, W. D., & Hatzes, A. P. 1993, in Planets Around Pulsars, eds. J. A. Phillips, S. E. Thorsett, & S. R. Kulkarni, ASP Conf. Ser., 36, 267 [Google Scholar]
- Cochran, W. D., Endl, M., McArthur, B., et al. 2004, ApJ, 611, L133 [NASA ADS] [CrossRef] [Google Scholar]
- Cosentino, R., Lovis, C., Pepe, F., et al. 2012, in SPIE Conf. Ser., 8446 [Google Scholar]
- Currie, T. 2009, ApJ, 694, L171 [NASA ADS] [CrossRef] [Google Scholar]
- Döllinger, M. P., Hatzes, A. P., Pasquini, L., Guenther, E. W., & Hartmann, M. 2009, A&A, 505, 1311 [NASA ADS] [CrossRef] [EDP Sciences] [Google Scholar]
- Duncan, D. K., Vaughan, A. H., Wilson, O. C., et al. 1991, ApJS, 76, 383 [NASA ADS] [CrossRef] [Google Scholar]
- Eberhard, G., & Schwarzschild, K. 1913, ApJ, 38, 292 [NASA ADS] [CrossRef] [Google Scholar]
- Fellgett, P. 1955, Opt. Acta, 2, 9 [NASA ADS] [CrossRef] [Google Scholar]
- Ford, E. B., & Gregory, P. C. 2007, in Statistical Challenges in Modern Astronomy IV, eds. G. J. Babu, & E. D. Feigelson, ASP Conf. Ser., 371, 189 [Google Scholar]
- Frink, S., Mitchell, D. S., Quirrenbach, A., et al. 2002, ApJ, 576, 478 [NASA ADS] [CrossRef] [MathSciNet] [Google Scholar]
- Gettel, S., Wolszczan, A., Niedzielski, A., et al. 2012, ApJ, 745, 28 [NASA ADS] [CrossRef] [Google Scholar]
- Gomes da Silva, J., Santos, N. C., Bonfils, X., et al. 2012, A&A, 541, A9 [NASA ADS] [CrossRef] [EDP Sciences] [Google Scholar]
- Goździewski, K., & Migaszewski, C. 2006, A&A, 449, 1219 [NASA ADS] [CrossRef] [EDP Sciences] [Google Scholar]
- Goździewski, K., Konacki, M., & Maciejewski, A. J. 2003, ApJ, 594, 1019 [NASA ADS] [CrossRef] [Google Scholar]
- Goździewski, K., Maciejewski, A. J., & Migaszewski, C. 2007, ApJ, 657, 546 [NASA ADS] [CrossRef] [Google Scholar]
- Griffin, R. F. 1967, ApJ, 148, 465 [NASA ADS] [CrossRef] [Google Scholar]
- Haggkvist, L., & Oja, T. 1973, A&AS, 12, 381 [NASA ADS] [Google Scholar]
- Hatzes, A. P. 2002, Astron. Nachr., 323, 392 [NASA ADS] [CrossRef] [Google Scholar]
- Hatzes, A. P., & Cochran, W. D. 1993, ApJ, 413, 339 [NASA ADS] [CrossRef] [Google Scholar]
- Hatzes, A. P., Guenther, E. W., Endl, M., et al. 2005, A&A, 437, 743 [NASA ADS] [CrossRef] [EDP Sciences] [Google Scholar]
- Høg, E., Fabricius, C., Makarov, V. V., et al. 2000, A&A, 355, L27 [NASA ADS] [Google Scholar]
- Howard, A. W., Marcy, G. W., Bryson, S. T., et al. 2012, ApJS, 201, 15 [NASA ADS] [CrossRef] [Google Scholar]
- Jofré, E., Petrucci, R., Saffe, C., et al. 2015, A&A, 574, A50 [NASA ADS] [CrossRef] [EDP Sciences] [Google Scholar]
- Johnson, J. A., Fischer, D. A., Marcy, G. W., et al. 2007, ApJ, 665, 785 [NASA ADS] [CrossRef] [Google Scholar]
- Johnson, J. A., Bowler, B. P., Howard, A. W., et al. 2010, ApJ, 721, L153 [NASA ADS] [CrossRef] [Google Scholar]
- Johnson, J. A., Clanton, C., Howard, A. W., et al. 2011, ApJS, 197, 26 [NASA ADS] [CrossRef] [Google Scholar]
- Kennedy, G. M., & Kenyon, S. J. 2009, ApJ, 695, 1210 [NASA ADS] [CrossRef] [Google Scholar]
- Kjeldsen, H., & Bedding, T. R. 1995, A&A, 293, 87 [NASA ADS] [Google Scholar]
- Kuerster, M., Schmitt, J. H. M. M., Cutispoto, G., & Dennerl, K. 1997, A&A, 320, 831 [NASA ADS] [Google Scholar]
- Kunitomo, M., Ikoma, M., Sato, B., Katsuta, Y., & Ida, S. 2011, ApJ, 737, 66 [NASA ADS] [CrossRef] [Google Scholar]
- Lee, B.-C., Mkrtichian, D. E., Han, I., Kim, K.-M., & Park, M.-G. 2011, A&A, 529, A134 [NASA ADS] [CrossRef] [EDP Sciences] [Google Scholar]
- Lillo-Box, J., Barrado, D., Moya, A., et al. 2014, A&A, 562, A109 [NASA ADS] [CrossRef] [EDP Sciences] [Google Scholar]
- Lin, D. N. C., Bodenheimer, P., & Richardson, D. C. 1996, Nature, 380, 606 [NASA ADS] [CrossRef] [Google Scholar]
- Lomb, N. R. 1976, Ap&SS, 39, 447 [NASA ADS] [CrossRef] [Google Scholar]
- Lovis, C., & Mayor, M. 2007, A&A, 472, 657 [NASA ADS] [CrossRef] [EDP Sciences] [Google Scholar]
- Maciejewski, G., Niedzielski, A., Wolszczan, A., et al. 2013, AJ, 146, 147 [NASA ADS] [CrossRef] [Google Scholar]
- Maldonado, J., Villaver, E., & Eiroa, C. 2013, A&A, 554, A84 [NASA ADS] [CrossRef] [EDP Sciences] [Google Scholar]
- Marcy, G. W., & Butler, R. P. 1992, PASP, 104, 270 [NASA ADS] [CrossRef] [Google Scholar]
- Marcy, G. W., Butler, R. P., Vogt, S. S., et al. 2005, ApJ, 619, 570 [NASA ADS] [CrossRef] [Google Scholar]
- Markwardt, C. B. 2009, in Astronomical Data Analysis Software and Systems XVIII, eds. D. A. Bohlender, D. Durand, & P. Dowler, ASP Conf. Ser., 411, 251 [Google Scholar]
- Mayor, M., & Queloz, D. 1995, Nature, 378, 355 [NASA ADS] [CrossRef] [Google Scholar]
- Mayor, M., Pepe, F., Queloz, D., et al. 2003, The Messenger, 114, 20 [NASA ADS] [Google Scholar]
- Murdoch, K. A., Hearnshaw, J. B., & Clark, M. 1993, ApJ, 413, 349 [NASA ADS] [CrossRef] [Google Scholar]
- Mustill, A. J., Veras, D., & Villaver, E. 2014, MNRAS, 437, 1404 [NASA ADS] [CrossRef] [Google Scholar]
- Ngo, H., Knutson, H. A., Hinkley, S., et al. 2015, ApJ, 800, 138 [NASA ADS] [CrossRef] [Google Scholar]
- Niedzielski, A., & Wolszczan, A. 2008, in Extreme Solar Systems, eds. D. Fischer, F. A. Rasio, S. E. Thorsett, & A. Wolszczan, ASP Conf. Ser., 398, 71 [Google Scholar]
- Niedzielski, A., Konacki, M., Wolszczan, A., et al. 2007, ApJ, 669, 1354 [NASA ADS] [CrossRef] [Google Scholar]
- Niedzielski, A., Villaver, E., Wolszczan, A., et al. 2015a, A&A, 573, A36 [NASA ADS] [CrossRef] [EDP Sciences] [Google Scholar]
- Niedzielski, A., Wolszczan, A., Nowak, G., et al. 2015b, ApJ, 803, 1 [Google Scholar]
- Niedzielski, A., Deka-Szymankiewicz, B., Adamczyk, M., et al. 2016, A&A, 585, A73 [NASA ADS] [CrossRef] [EDP Sciences] [Google Scholar]
- Nowak, G. 2012, Ph.D. Thesis, Nicolaus Copernicus Univ., Toruń, Poland [Google Scholar]
- Nowak, G., Niedzielski, A., Wolszczan, A., Adamów, M., & Maciejewski, G. 2013, ApJ, 770, 53 [Google Scholar]
- Noyes, R. W., Hartmann, L. W., Baliunas, S. L., Duncan, D. K., & Vaughan, A. H. 1984, ApJ, 279, 763 [NASA ADS] [CrossRef] [Google Scholar]
- Pepe, F., Mayor, M., Galland, F., et al. 2002, A&A, 388, 632 [NASA ADS] [CrossRef] [EDP Sciences] [Google Scholar]
- Pojmanski, G. 1997, Acta Astron., 47, 467 [NASA ADS] [Google Scholar]
- Pollacco, D. L., Skillen, I., Collier Cameron, A., et al. 2006, PASP, 118, 1407 [NASA ADS] [CrossRef] [Google Scholar]
- Pollack, J. B., Hubickyj, O., Bodenheimer, P., et al. 1996, Icarus, 124, 62 [NASA ADS] [CrossRef] [Google Scholar]
- Press, W. H., Teukolsky, S. A., Vetterling, W. T., & Flannery, B. P. 1992, Numerical recipes in FORTRAN. The art of scientific computing (Cambridge University Press) [Google Scholar]
- Queloz, D. 1995, in New Developments in Array Technology and Applications, eds. A. G. D. Philip, K. Janes, & A. R. Upgren, IAU Symp., 167, 221 [Google Scholar]
- Queloz, D., Henry, G. W., Sivan, J. P., et al. 2001, A&A, 379, 279 [NASA ADS] [CrossRef] [EDP Sciences] [Google Scholar]
- Ramsey, L. W., Adams, M. T., Barnes, T. G., et al. 1998, in SPIE Conf. Ser., 3352, ed. L. M. Stepp, 34 [Google Scholar]
- Rasio, F. A., & Ford, E. B. 1996, Science, 274, 954 [NASA ADS] [CrossRef] [PubMed] [Google Scholar]
- Reffert, S., Bergmann, C., Quirrenbach, A., Trifonov, T., & Künstler, A. 2015, A&A, 574, A116 [NASA ADS] [CrossRef] [EDP Sciences] [Google Scholar]
- Ribas, Á., Bouy, H., & Merín, B. 2015, A&A, 576, A52 [NASA ADS] [CrossRef] [EDP Sciences] [Google Scholar]
- Robertson, P., Endl, M., Cochran, W. D., & Dodson-Robinson, S. E. 2013, ApJ, 764, 3 [NASA ADS] [CrossRef] [Google Scholar]
- Robertson, P., Mahadevan, S., Endl, M., & Roy, A. 2014, Science, 345, 440 [NASA ADS] [CrossRef] [Google Scholar]
- Sato, B., Ando, H., Kambe, E., et al. 2003, ApJ, 597, L157 [NASA ADS] [CrossRef] [Google Scholar]
- Sato, B., Izumiura, H., Toyota, E., et al. 2008, PASJ, 60, 539 [NASA ADS] [Google Scholar]
- Scargle, J. D. 1982, ApJ, 263, 835 [NASA ADS] [CrossRef] [Google Scholar]
- Setiawan, J., Hatzes, A. P., von der Lühe, O., et al. 2003a, A&A, 398, L19 [NASA ADS] [CrossRef] [EDP Sciences] [Google Scholar]
- Setiawan, J., Pasquini, L., da Silva, L., von der Lühe, O., & Hatzes, A. 2003b, A&A, 397, 1151 [NASA ADS] [CrossRef] [EDP Sciences] [Google Scholar]
- Shetrone, M., Cornell, M. E., Fowler, J. R., et al. 2007, PASP, 119, 556 [NASA ADS] [CrossRef] [Google Scholar]
- Takeda, Y., Ohkubo, M., Sato, B., Kambe, E., & Sadakane, K. 2005a, PASJ, 57, 27 [NASA ADS] [CrossRef] [Google Scholar]
- Takeda, Y., Sato, B., Kambe, E., et al. 2005b, PASJ, 57, 109 [Google Scholar]
- Tull, R. G. 1998, in SPIE Conf. Ser. 3355, ed. S. D’Odorico, 387 [Google Scholar]
- Valenti, J. A., & Piskunov, N. 1996, A&AS, 118, 595 [NASA ADS] [CrossRef] [EDP Sciences] [Google Scholar]
- Villaver, E., & Livio, M. 2007, ApJ, 661, 1192 [NASA ADS] [CrossRef] [Google Scholar]
- Villaver, E., & Livio, M. 2009, ApJ, 705, L81 [NASA ADS] [CrossRef] [Google Scholar]
- Villaver, E., Livio, M., Mustill, A. J., & Siess, L. 2014, ApJ, 794, 3 [NASA ADS] [CrossRef] [Google Scholar]
- Woźniak, P. R., Vestrand, W. T., Akerlof, C. W., et al. 2004, AJ, 127, 2436 [NASA ADS] [CrossRef] [Google Scholar]
- Wright, J. T., & Howard, A. W. 2009, ApJS, 182, 205 [NASA ADS] [CrossRef] [Google Scholar]
- Wright, J. T., Marcy, G. W., Fischer, D. A., et al. 2007, ApJ, 657, 533 [NASA ADS] [CrossRef] [Google Scholar]
- Wright, J. T., Marcy, G. W., Howard, A. W., et al. 2012, ApJ, 753, 160 [NASA ADS] [CrossRef] [Google Scholar]
- Zieliński, P., Niedzielski, A., Wolszczan, A., Adamów, M., & Nowak, G. 2012, A&A, 547, A91 [NASA ADS] [CrossRef] [EDP Sciences] [Google Scholar]
Appendix A: Radial velocity tables
HET and HRS RV and BS measurements [m s-1] of HD 5583.
TNG and HARPS-N RV and BS measurements [km s-1] of HD 5583.
HET and HRS RV and BS measurements [m s-1] of BD+15 2375.
TNG and HARPS-N RV and BS measurements [km s-1] of BD+15 2375.
All Tables
All Figures
|
Fig. 1 Lomb Scargle priodograms for HD 5583, top to bottom: combined RV data, Super WASP photometry and RV residua. False alarm probability levels of p = 0.01 and 0.001 are marked with horizontal lines. |
| In the text | |
|
Fig. 2 Lomb Scargle priodograms for BD+15 2735, top to bottom: combined RV data, ASAS photometry and RV residua. False alarm probability levels of p = 0.01 and 0.001 are marked with horizontal lines. |
| In the text | |
|
Fig. 3 Keplerian orbital fit for HD 5583 b. In red HET HRS data, in green TNG HARPS-N data. Jitter is added to RV uncertainties. |
| In the text | |
|
Fig. 4 Keplerian orbital fit for BD+15 2735 b. In red HET HRS data, in green TNG HARPS-N data. Jitter is added to RV uncertainties. |
| In the text | |
|
Fig. 5 Hertzsprung-Russell diagram for the complete PTPS sample with HD 5583 and BD+15 2735 and their evolutionary tracks. We show the stage when stellar radius reaches current planetary orbits in red. |
| In the text | |
|
Fig. 6 Semi-major axis distributions for (top to bottom) dwarfs (here log g = 4.5 ± 0.5), subgiants (here log g = 3.5 ± 0.5), giants (here log g = 2.5 ± 0.5) and bright giants (here log g = 1.5 ± 0.5). In blue: RV planets only; in red: all other technique planets, including Kepler. In every 0.25 dex range, two bars are presented, left for hosts of ≤ 1.2 M/M⊙, and right > 1.2 M/M⊙. Planets with very extended orbits are omitted for clarity. The positions of the two planets presented in this paper are indicated by arrows. |
| In the text | |
Current usage metrics show cumulative count of Article Views (full-text article views including HTML views, PDF and ePub downloads, according to the available data) and Abstracts Views on Vision4Press platform.
Data correspond to usage on the plateform after 2015. The current usage metrics is available 48-96 hours after online publication and is updated daily on week days.
Initial download of the metrics may take a while.