Fig. 5
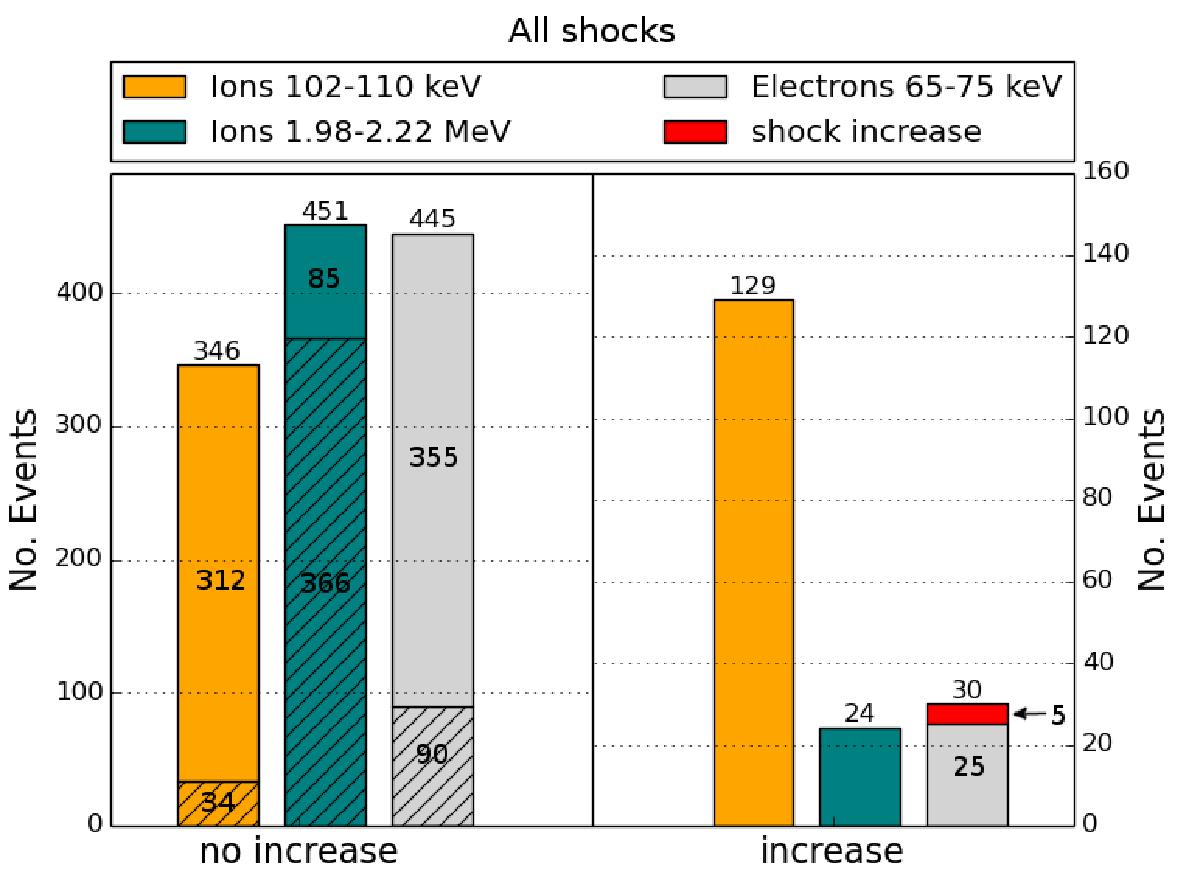
Histogram of all shock crossings. The yellow, green, and gray bars represent 102−110 keV ions, 1.98−2.22 MeV ions, and 65−75 keV electrons, respectively. The left panel shows the number of shock crossings without a shock-associated increase. The lower parts of the bars (hatched) denote the events where only quiet-time background was measured, the upper parts of the bars represent periods of enhanced intensities which were, however, not due to the shock. The right panel shows the number of shock-associated increases. The bar representing electron increases is separated into a lower gray part, which shows the number of increases which were contaminated by ions or as a result of a solar event, and the upper red part, which represents the real shock-associated electron events.
Current usage metrics show cumulative count of Article Views (full-text article views including HTML views, PDF and ePub downloads, according to the available data) and Abstracts Views on Vision4Press platform.
Data correspond to usage on the plateform after 2015. The current usage metrics is available 48-96 hours after online publication and is updated daily on week days.
Initial download of the metrics may take a while.