Fig. 4
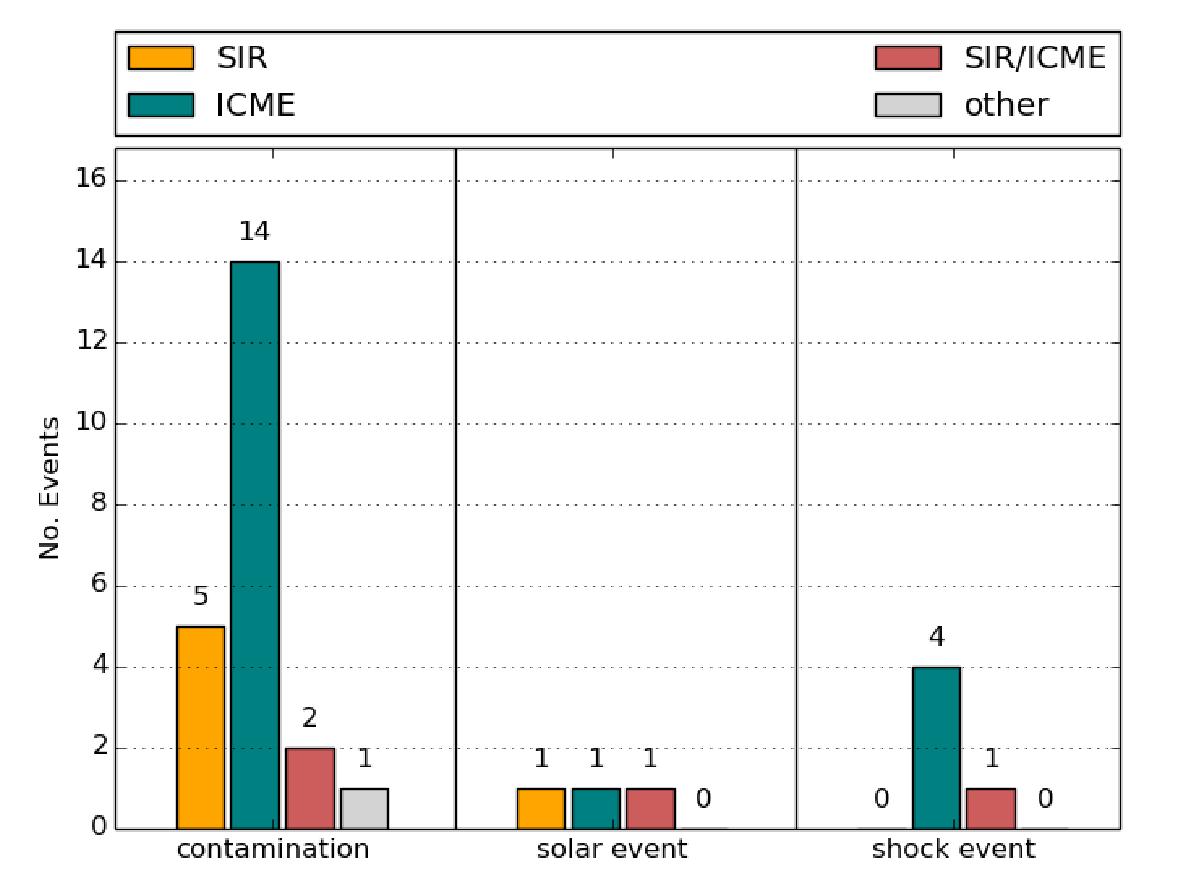
Histogram of all 65−75 keV electron increases during in situ shock crossings divided into cases of strong ion contamination (left), increases due to a solar event (middle), and real shock-accelerated increases (right). The chart furthermore divides the numbers as a function of the different shock sources: SIR (yellow), ICME (green), SIR/ICME mixture (red), and “other”, not clearly defined sources (gray).
Current usage metrics show cumulative count of Article Views (full-text article views including HTML views, PDF and ePub downloads, according to the available data) and Abstracts Views on Vision4Press platform.
Data correspond to usage on the plateform after 2015. The current usage metrics is available 48-96 hours after online publication and is updated daily on week days.
Initial download of the metrics may take a while.