Fig. 4
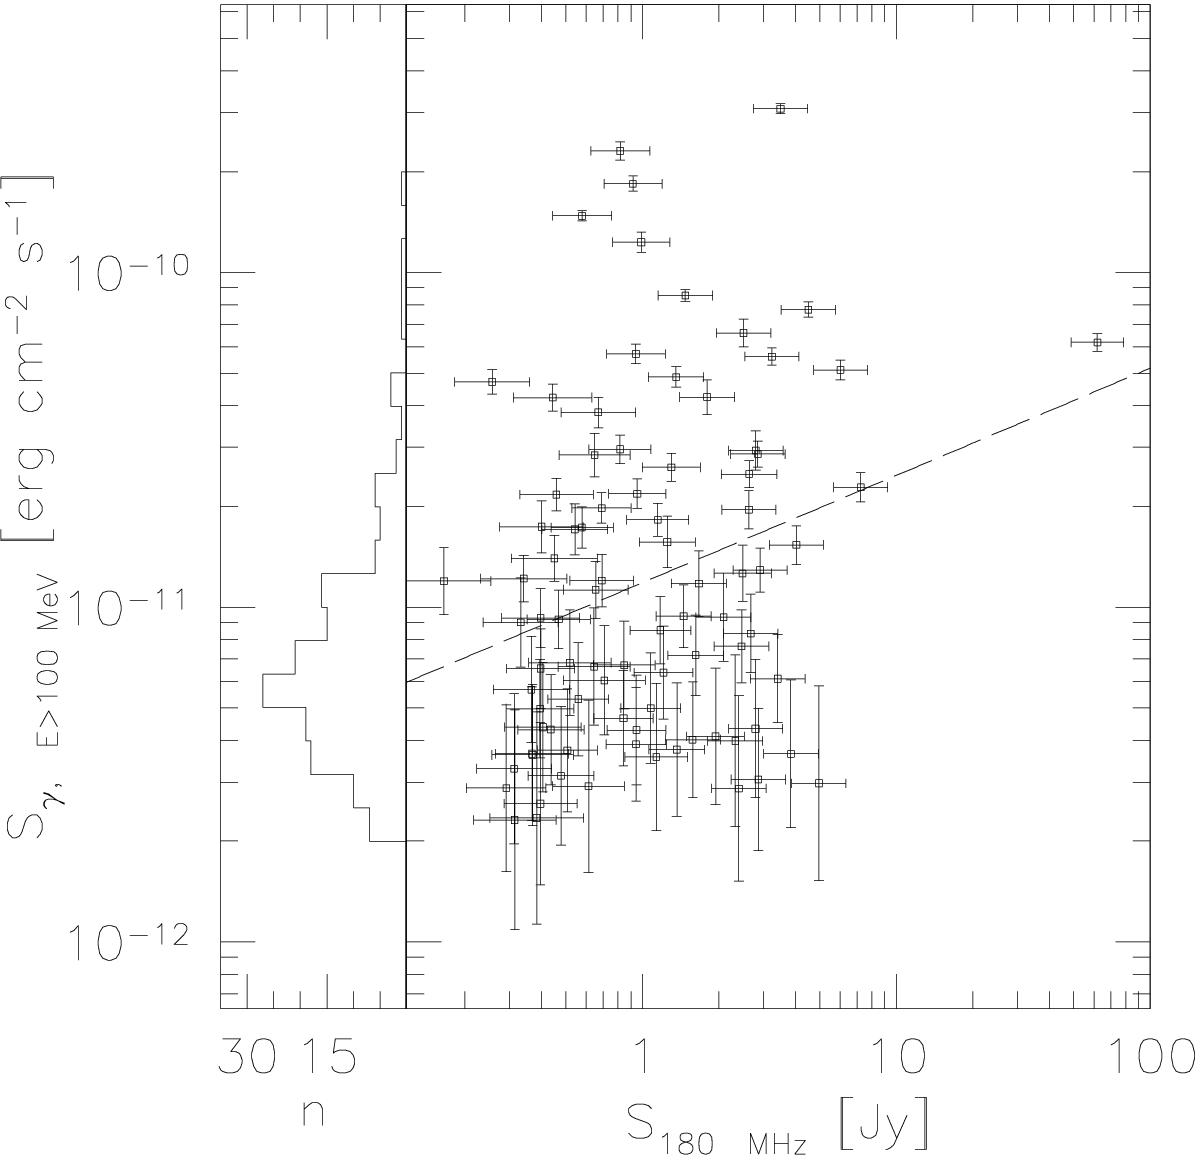
Fermi-LAT gamma-ray and MWACS fluxes for 3LAC blazars. In the main panel (right), we show the 4 yr gamma-ray energy flux at E> 100 MeV vs. MWACS radio flux density at 180 MHz; the dashed line is the best-fit linear regression. In the smaller left panel, we show the gamma-ray flux distribution for blazars that are not detected in MWACS; gamma-ray flux increases along the y-axis, and simple counts increase right-to-left along the x-axis.
Current usage metrics show cumulative count of Article Views (full-text article views including HTML views, PDF and ePub downloads, according to the available data) and Abstracts Views on Vision4Press platform.
Data correspond to usage on the plateform after 2015. The current usage metrics is available 48-96 hours after online publication and is updated daily on week days.
Initial download of the metrics may take a while.