Free Access
Fig. 3
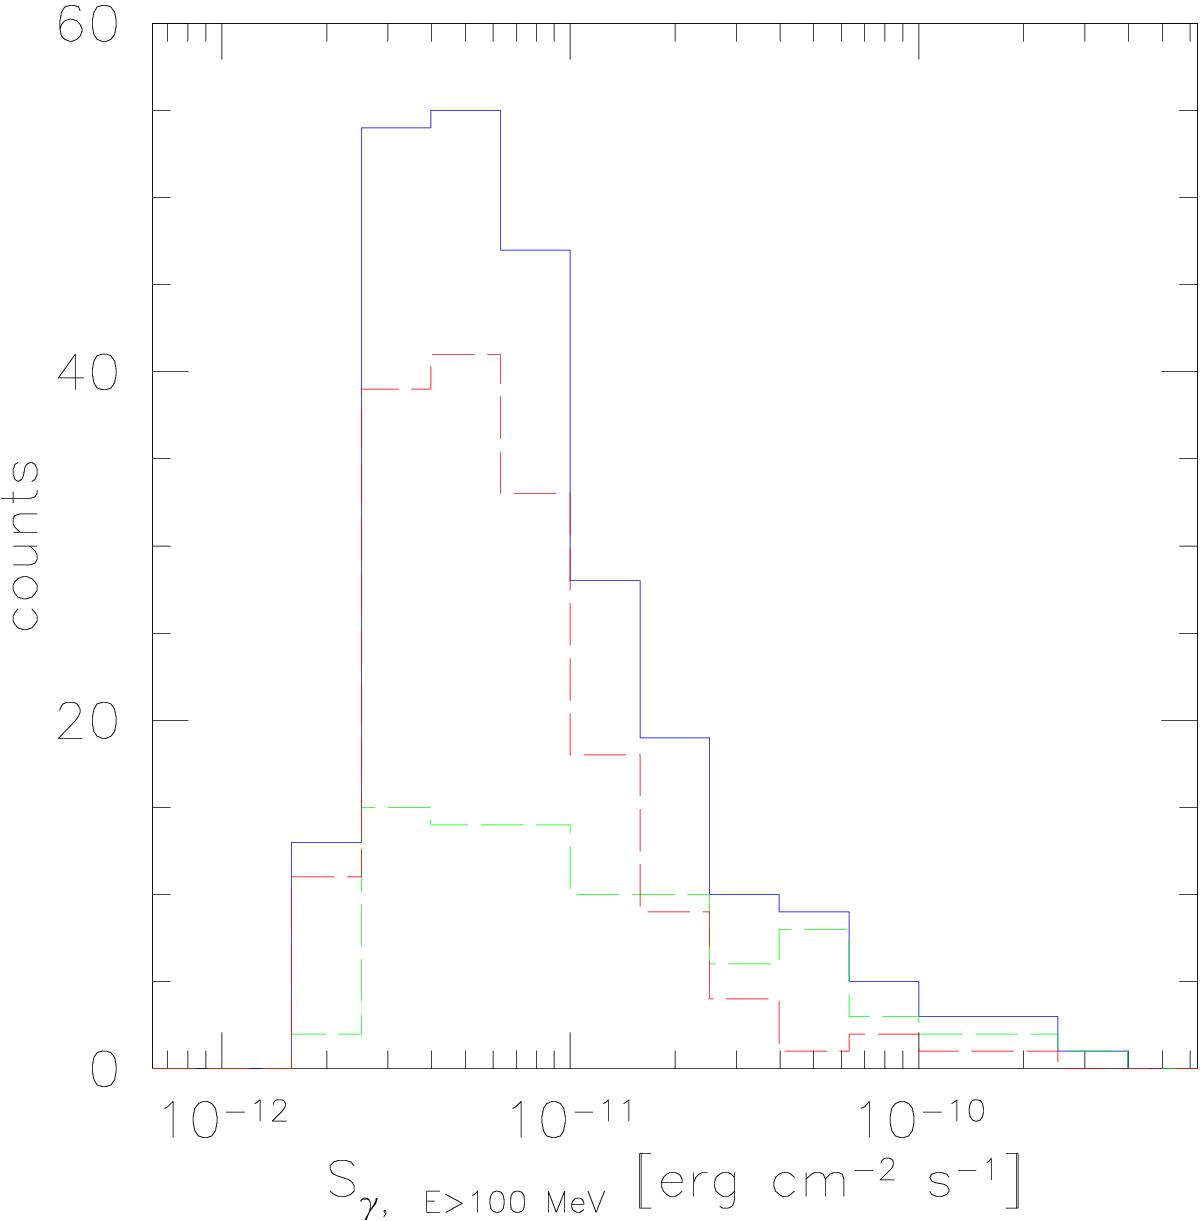
Gamma-ray flux at E> 100 MeV distribution for the entire 3LAC sample (solid blue line). Dashed lines show separately the distribution for 3LAC sources with or without an MWACS counterpart (green and red lines, respectively).
Current usage metrics show cumulative count of Article Views (full-text article views including HTML views, PDF and ePub downloads, according to the available data) and Abstracts Views on Vision4Press platform.
Data correspond to usage on the plateform after 2015. The current usage metrics is available 48-96 hours after online publication and is updated daily on week days.
Initial download of the metrics may take a while.