Fig. 2
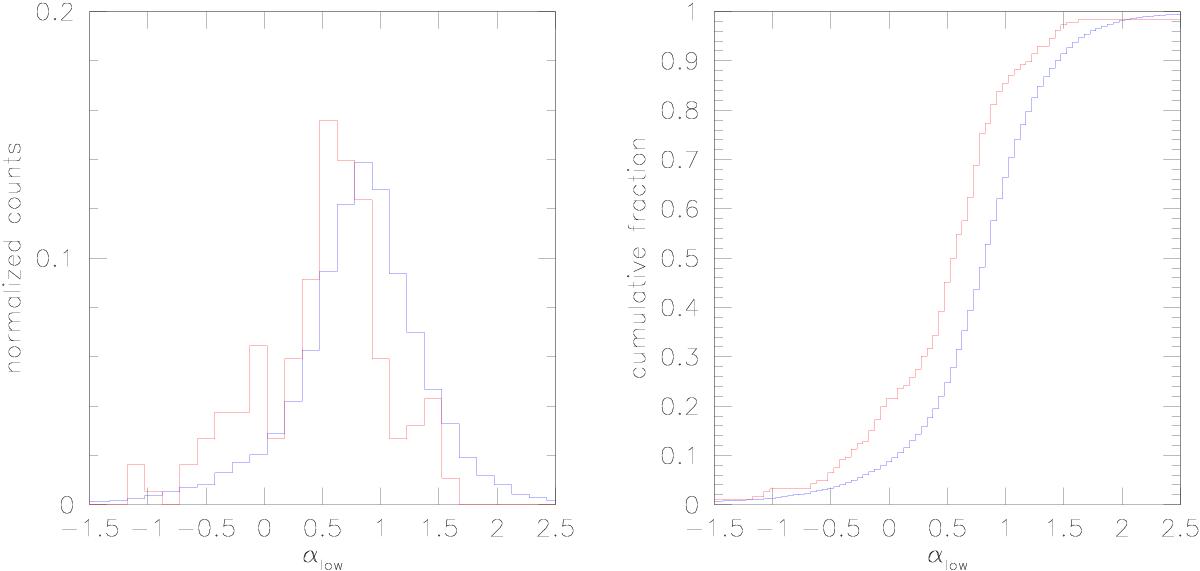
Low-frequency spectral index counts (left) and cumulative (right) distributions for the entire MWACS catalogue (blue line) compared with BZCat-MWACS blazars (red line). Because the population counts are very different, normalized distributions are shown. The x-axis range is limited to the interval −1.5 <αlow< 2.5 for illustration purposes.
Current usage metrics show cumulative count of Article Views (full-text article views including HTML views, PDF and ePub downloads, according to the available data) and Abstracts Views on Vision4Press platform.
Data correspond to usage on the plateform after 2015. The current usage metrics is available 48-96 hours after online publication and is updated daily on week days.
Initial download of the metrics may take a while.