Free Access
Fig. 1
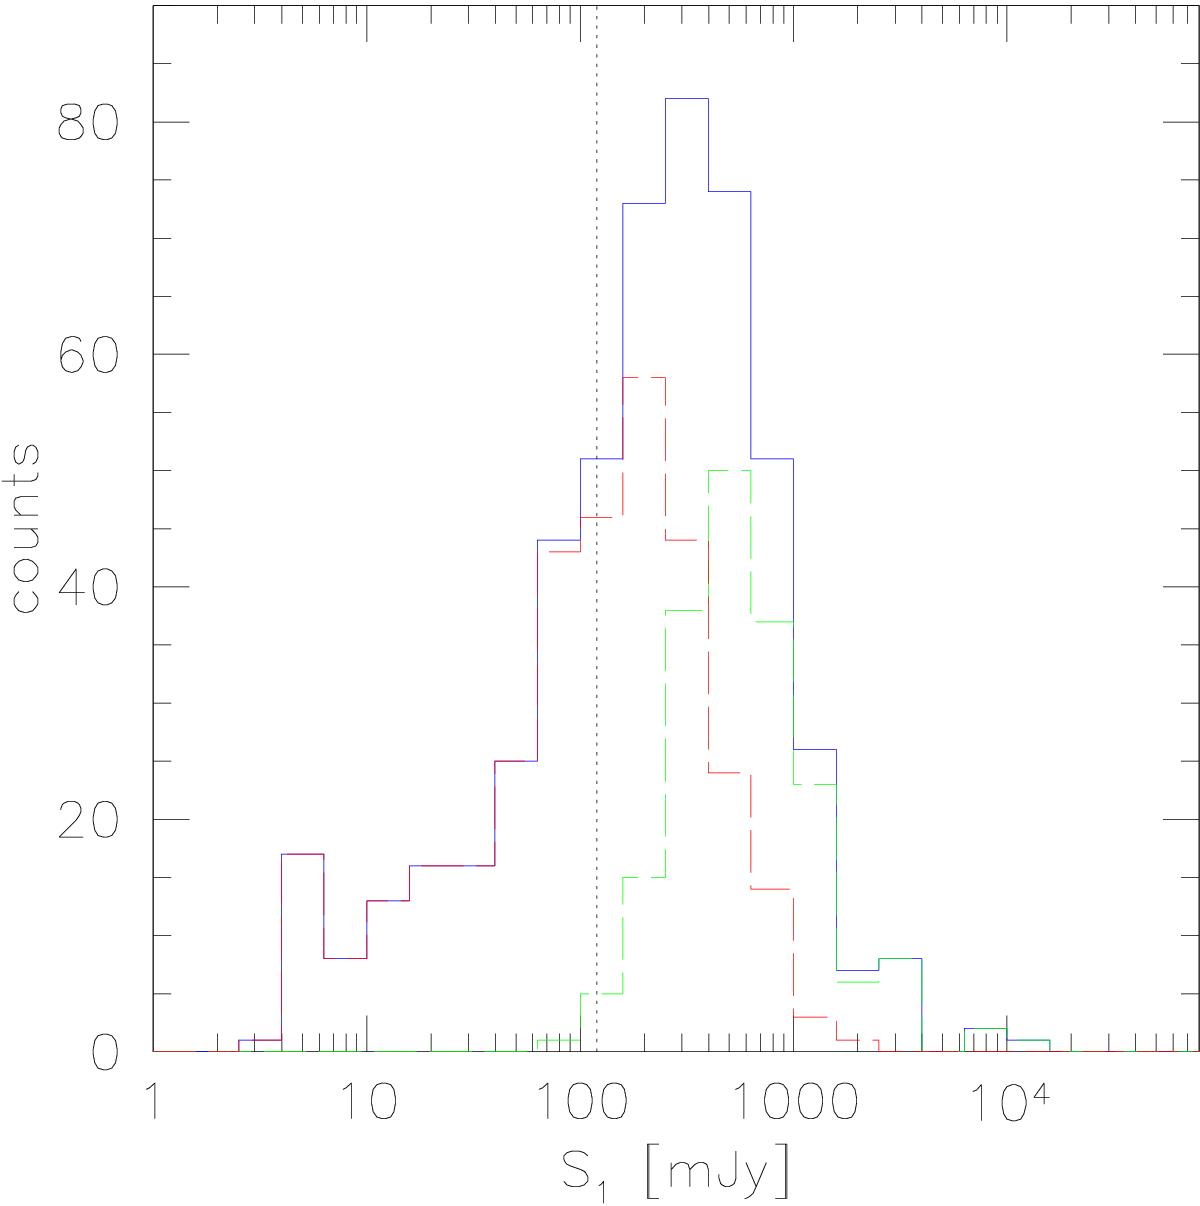
Blazar flux density distribution at 1 GHz for the entire BZCat (blue solid line) and for the detected (green dashed line) and not detected (red dashed line) subset in MWACS. The dotted vertical line corresponds to S1 = 120 mJy, i.e. the flux density limit of the MWACS survey extrapolated with α = 0.0.
Current usage metrics show cumulative count of Article Views (full-text article views including HTML views, PDF and ePub downloads, according to the available data) and Abstracts Views on Vision4Press platform.
Data correspond to usage on the plateform after 2015. The current usage metrics is available 48-96 hours after online publication and is updated daily on week days.
Initial download of the metrics may take a while.