Fig. 8
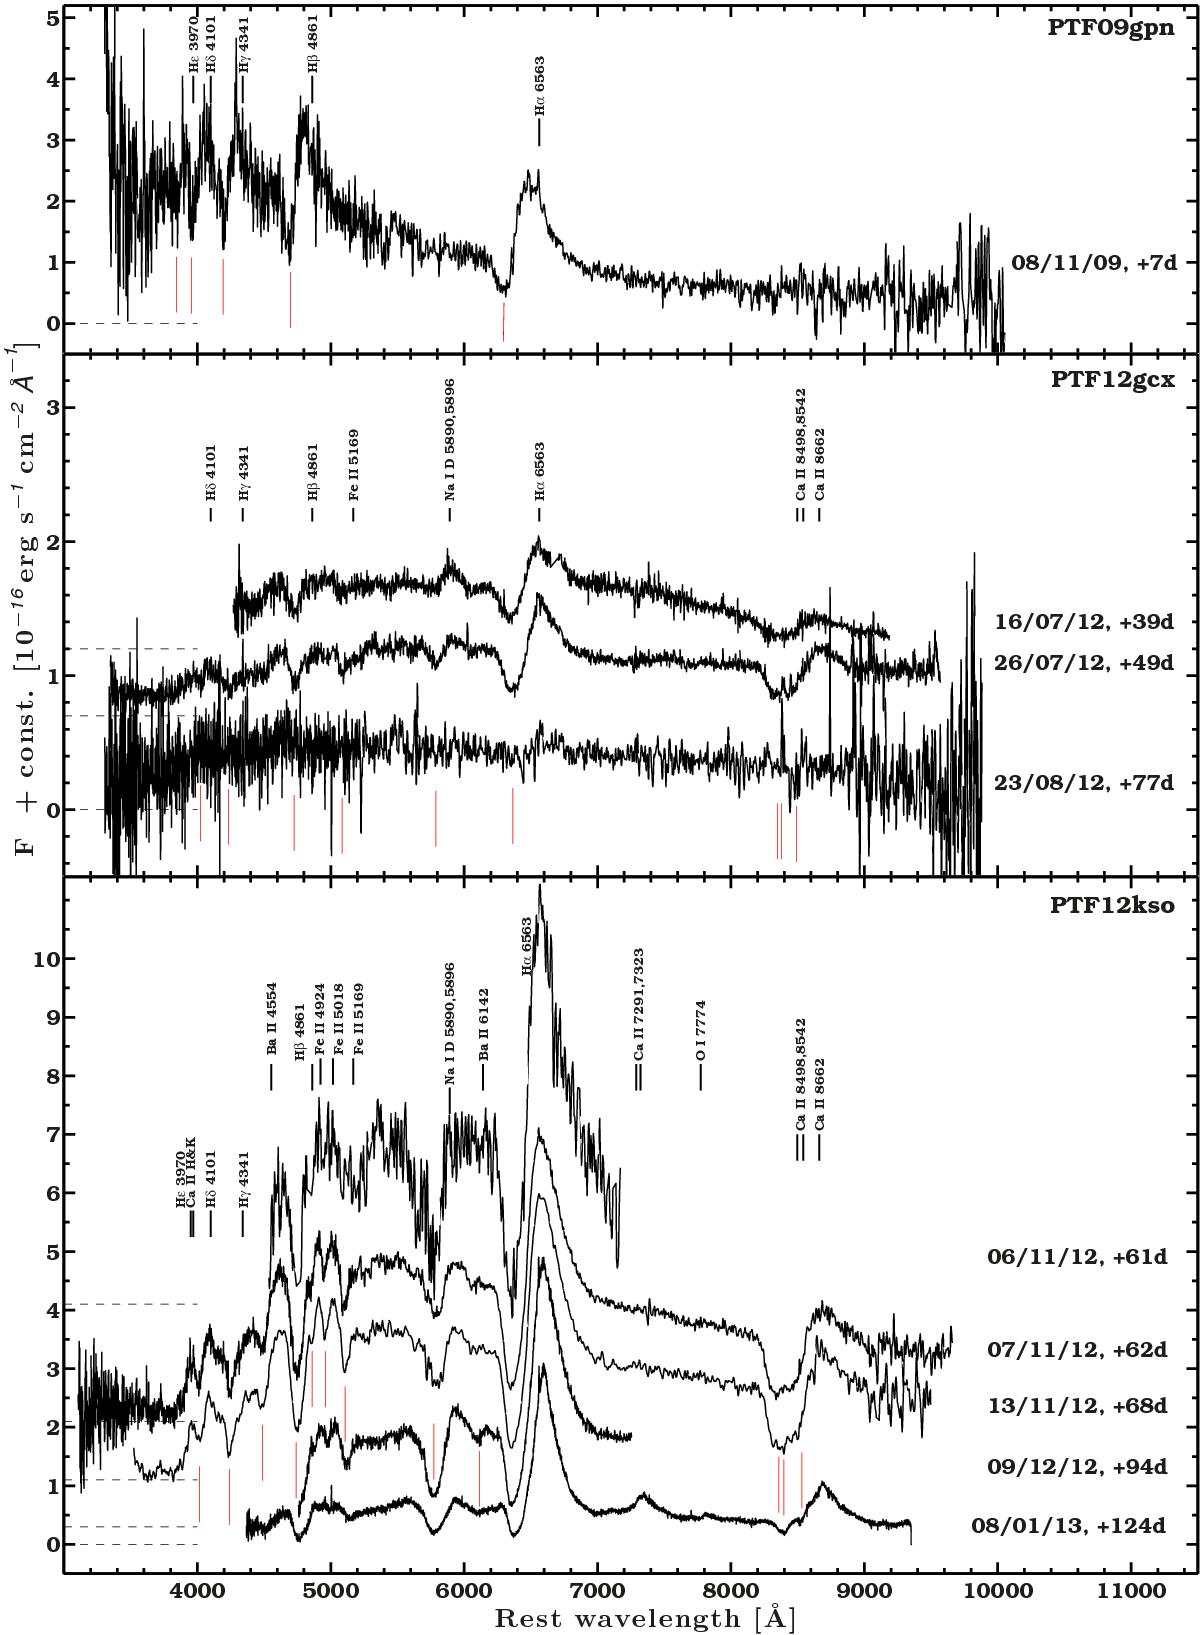
Spectral sequences for PTF09gpn, PTF12gcx, and PTF12kso. All spectra were calibrated against photometry and corrected for extinction. The main spectral lines, the dates, and the phases are reported. The absorption minimum of each line is marked by a red segment, the rest wavelength by a black segment. The zero-flux level is marked by a dashed horizontal line for each spectrum.
Current usage metrics show cumulative count of Article Views (full-text article views including HTML views, PDF and ePub downloads, according to the available data) and Abstracts Views on Vision4Press platform.
Data correspond to usage on the plateform after 2015. The current usage metrics is available 48-96 hours after online publication and is updated daily on week days.
Initial download of the metrics may take a while.