Fig. 13
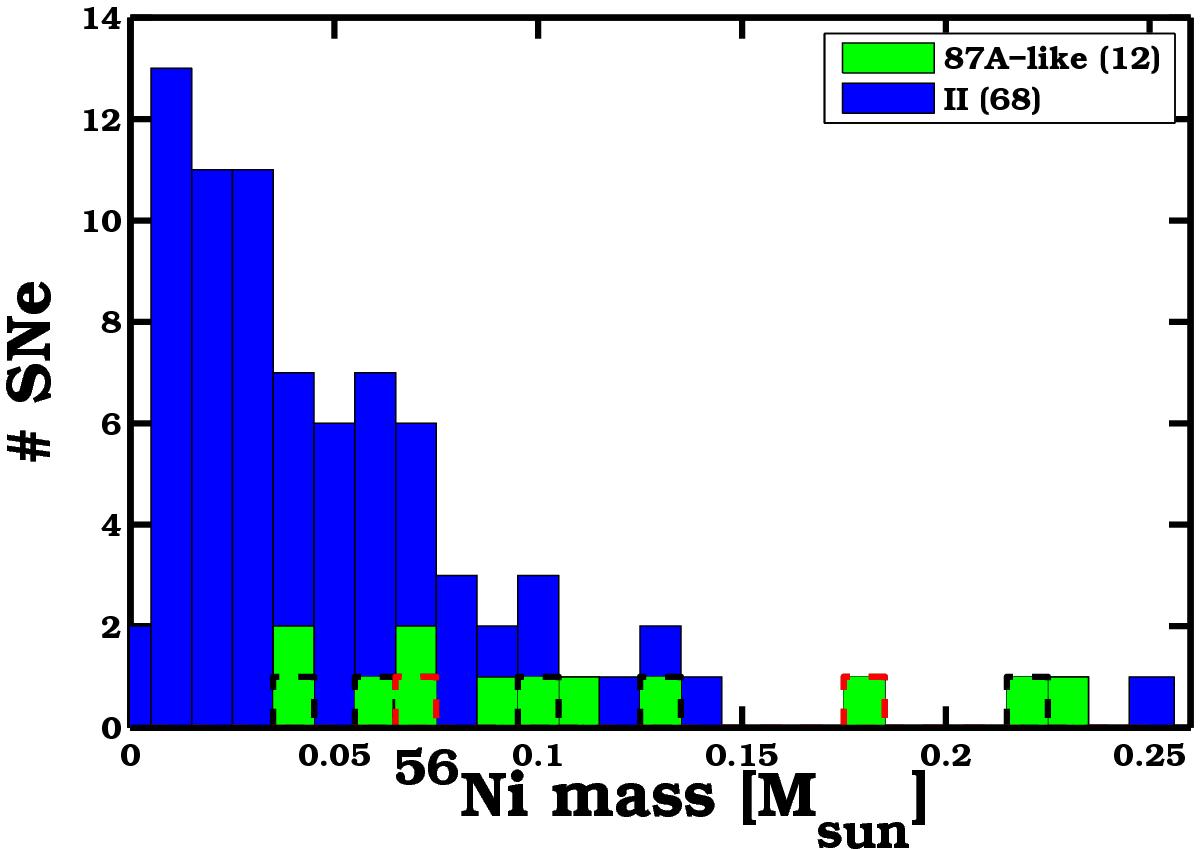
56Ni mass distribution for SNe II (IIP and IIL, estimates from Hamuy 2003; Inserra et al. 2013; Anderson et al. 2014; and Rubin et al. 2015) in blue, and our SN 1987A-like SNe in green. 56Ni mass estimates that are based on at most two points on the radioactive tail are highlighted by dashed edges (red lines indicate upper limits, black lines mark lower limits).
Current usage metrics show cumulative count of Article Views (full-text article views including HTML views, PDF and ePub downloads, according to the available data) and Abstracts Views on Vision4Press platform.
Data correspond to usage on the plateform after 2015. The current usage metrics is available 48-96 hours after online publication and is updated daily on week days.
Initial download of the metrics may take a while.