Fig. 11
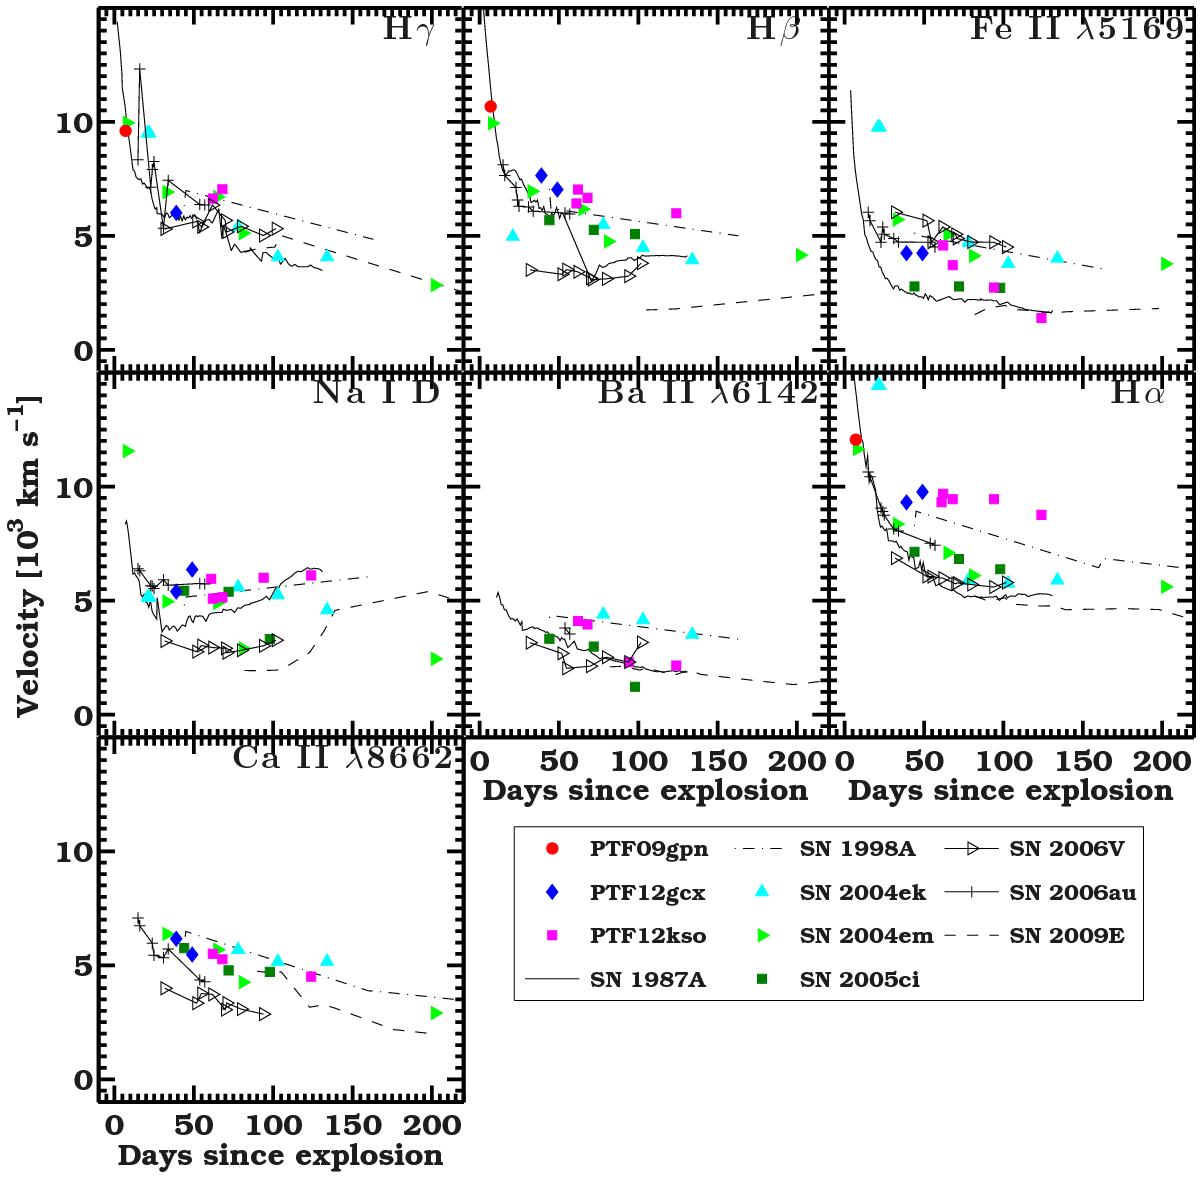
Velocity evolution from the P-Cygni absorption minima of the most important spectral lines for our PTF and CCCP SNe (colored symbols) as compared to SN 1987A and other long-rising SNe II (black symbols, from the spectra presented by Phillips et al. 1988; Pastorello et al. 2005, 2012; Taddia et al. 2012). Typical uncertainties are of 500–1000 km s-1.
Current usage metrics show cumulative count of Article Views (full-text article views including HTML views, PDF and ePub downloads, according to the available data) and Abstracts Views on Vision4Press platform.
Data correspond to usage on the plateform after 2015. The current usage metrics is available 48-96 hours after online publication and is updated daily on week days.
Initial download of the metrics may take a while.