Fig. 10
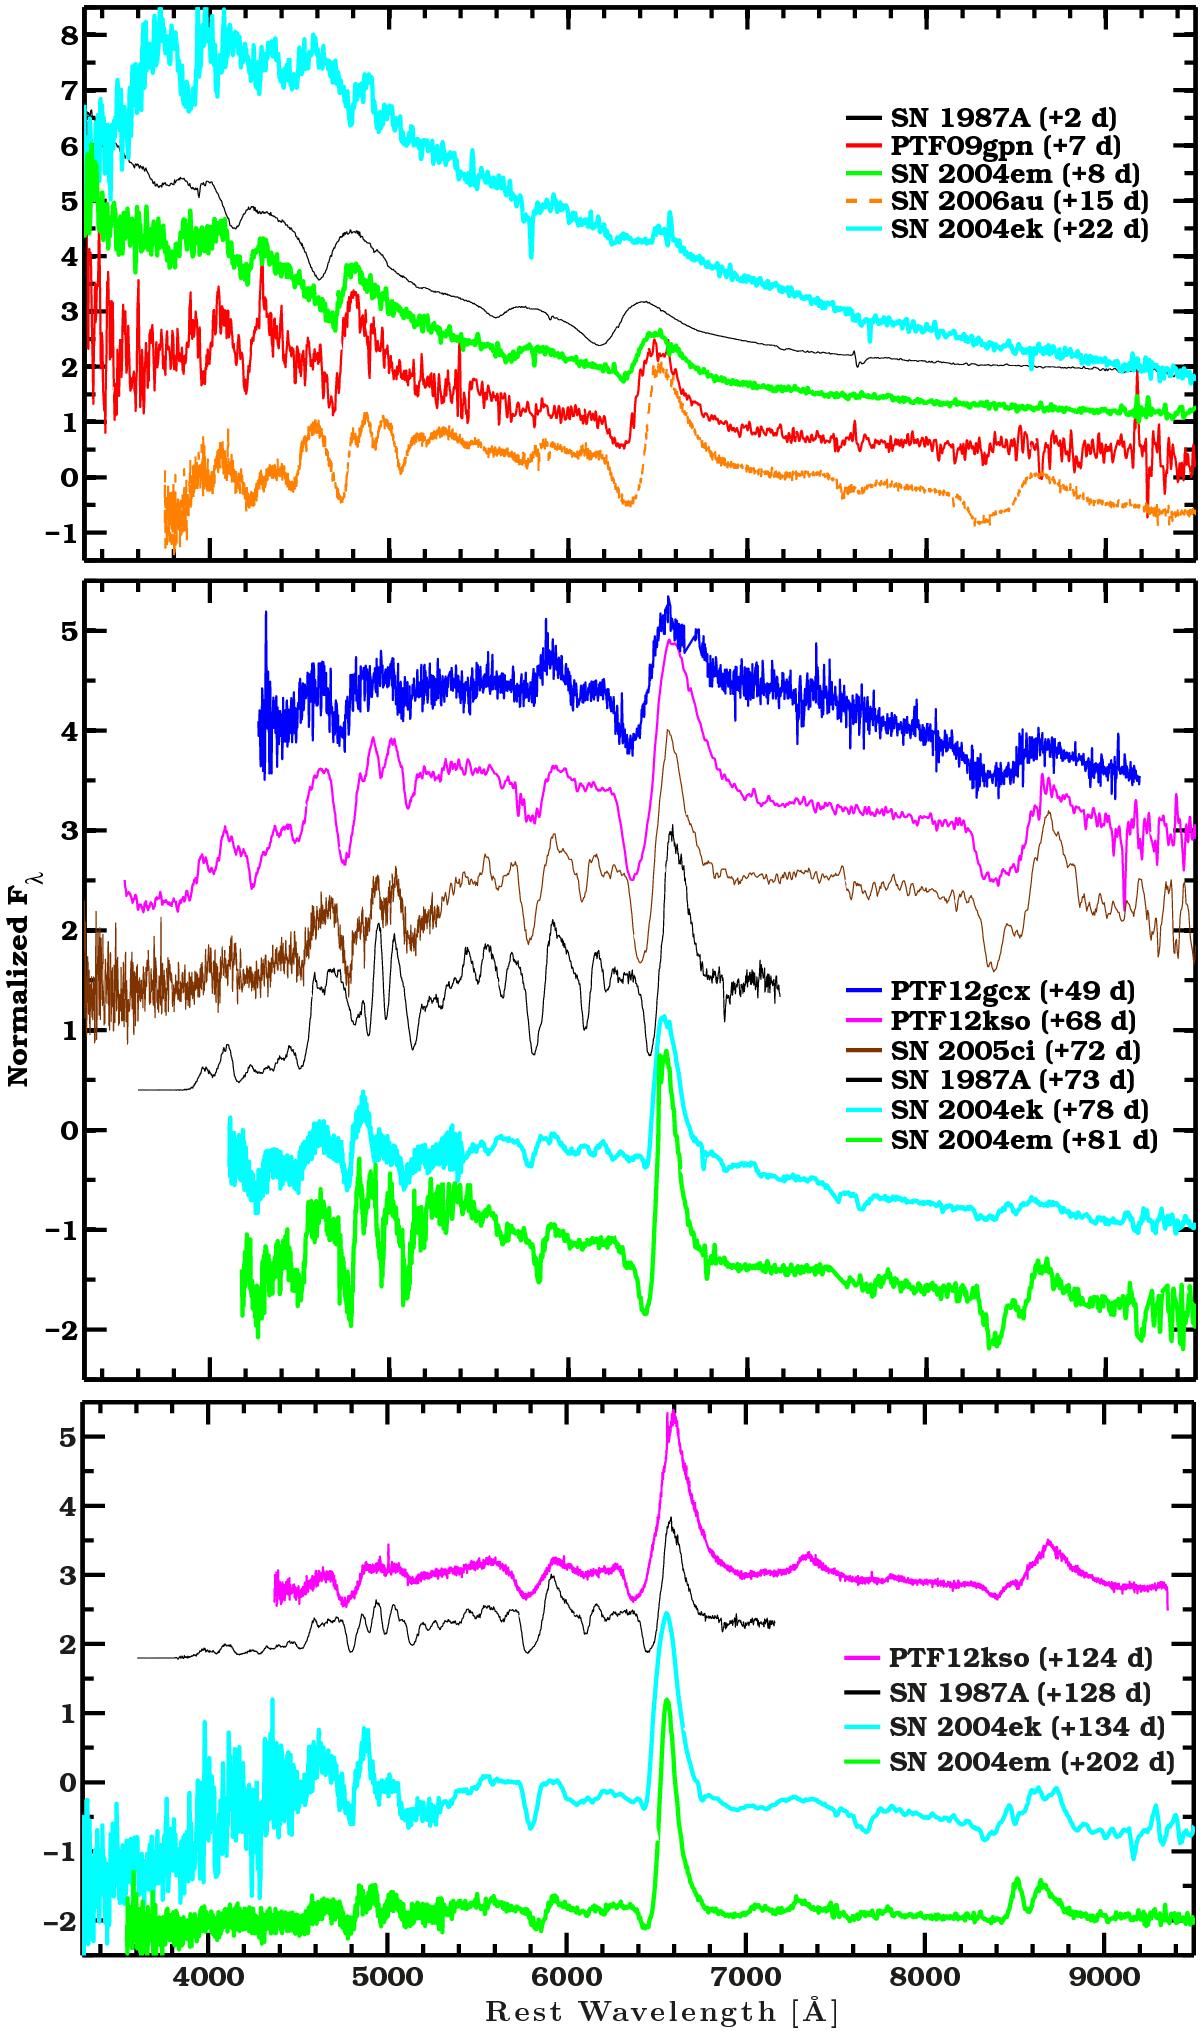
Spectral comparison among our PTF and CCCP long-rising SNe II, SN 1987A (from Phillips et al. 1988) and SN 2006au (from Taddia et al. 2012). The top panel includes spectra taken at early epochs, in the central panel we show spectra obtained around peak. The bottom panel presents spectra taken on the tail of the light curves.
Current usage metrics show cumulative count of Article Views (full-text article views including HTML views, PDF and ePub downloads, according to the available data) and Abstracts Views on Vision4Press platform.
Data correspond to usage on the plateform after 2015. The current usage metrics is available 48-96 hours after online publication and is updated daily on week days.
Initial download of the metrics may take a while.