Fig. 9
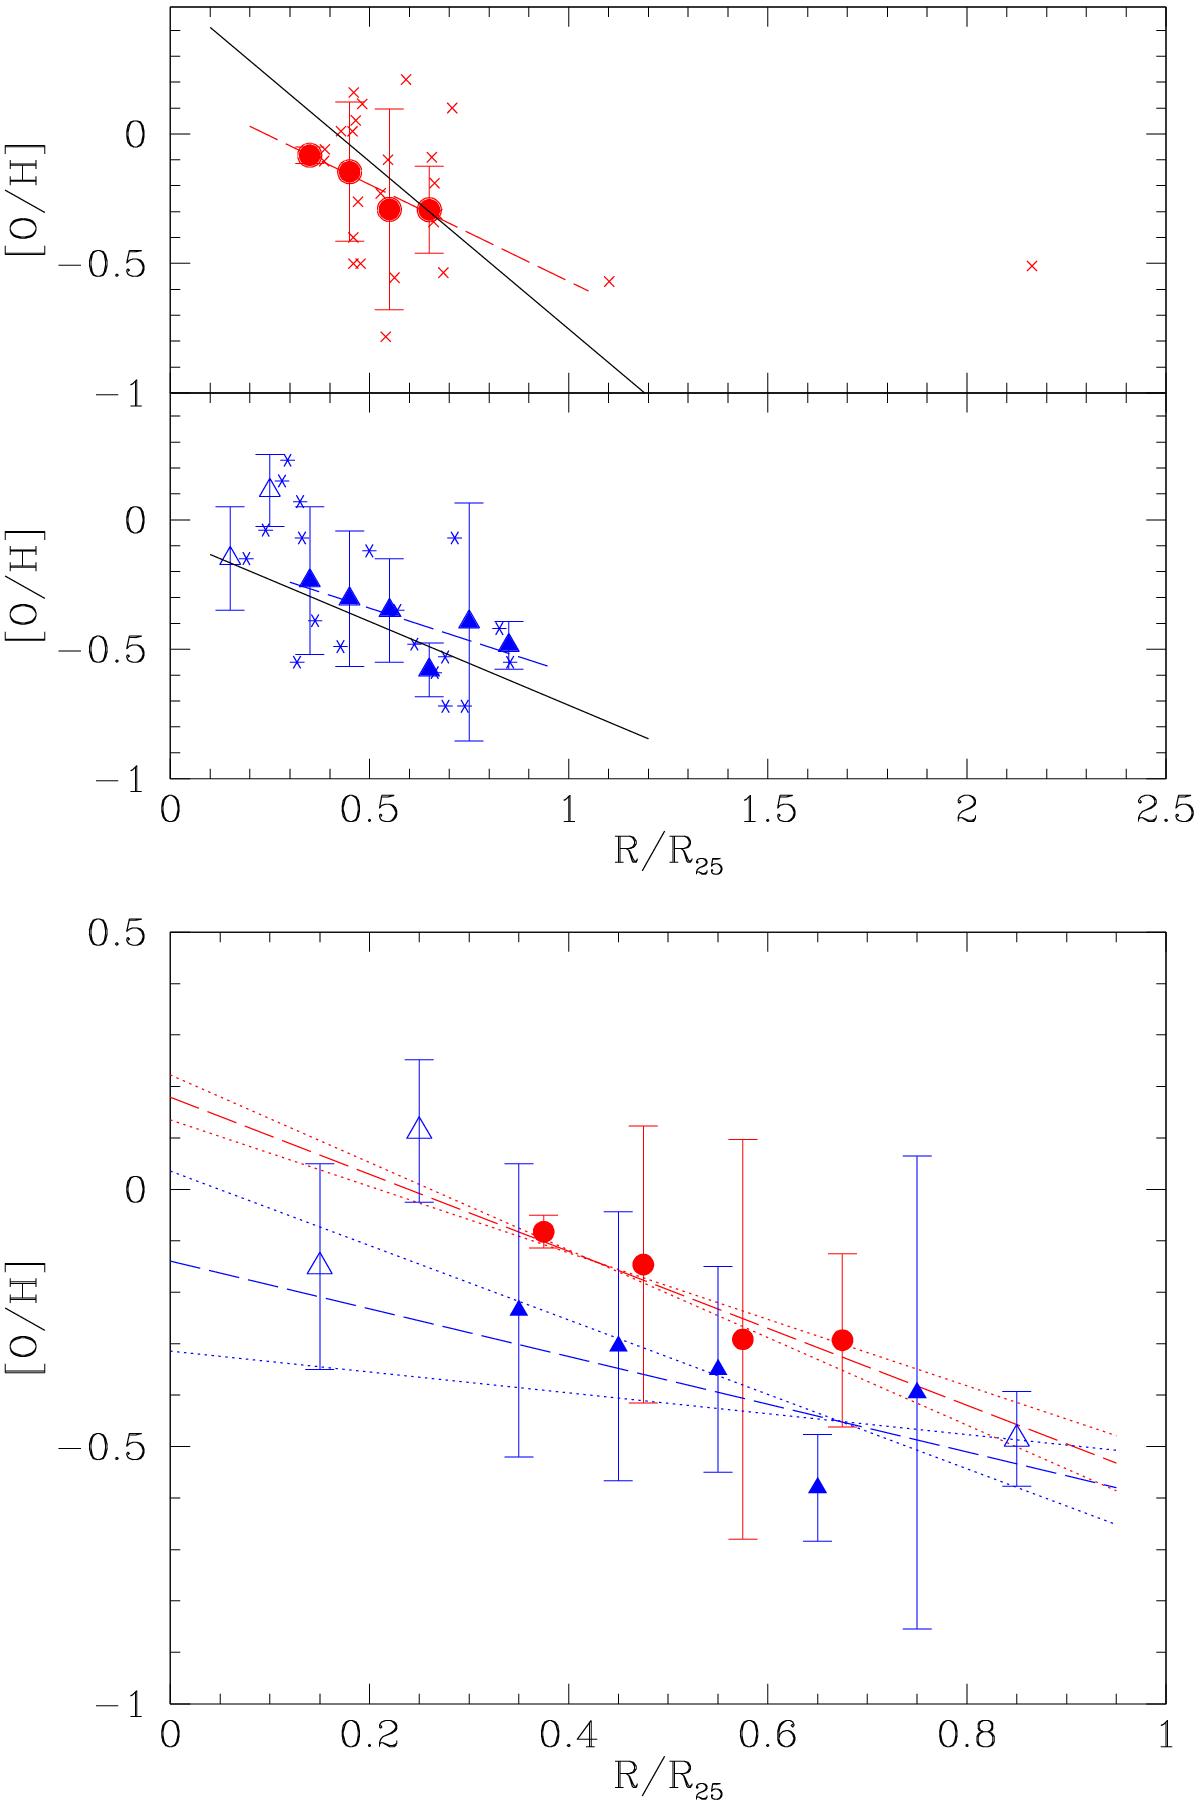
M81. Upper panel: individual and binned results for H ii regions (upper panel) and PNe (lower panel). The O abundances of PNe are taken from Stanghellini et al. (2010) and those of H ii regions from Stanghellini et al. (2010, 2014) and Patterson et al. (2012). The continuous black lines are the gradient of Stanghellini et al. (2014) for PNe and that of Stanghellini et al. (2014) for H ii regions. Lower panel: weighted linear fits of PN and H ii region binned metallicities. Symbols and curves as in Fig. 6.
Current usage metrics show cumulative count of Article Views (full-text article views including HTML views, PDF and ePub downloads, according to the available data) and Abstracts Views on Vision4Press platform.
Data correspond to usage on the plateform after 2015. The current usage metrics is available 48-96 hours after online publication and is updated daily on week days.
Initial download of the metrics may take a while.