Fig. 6
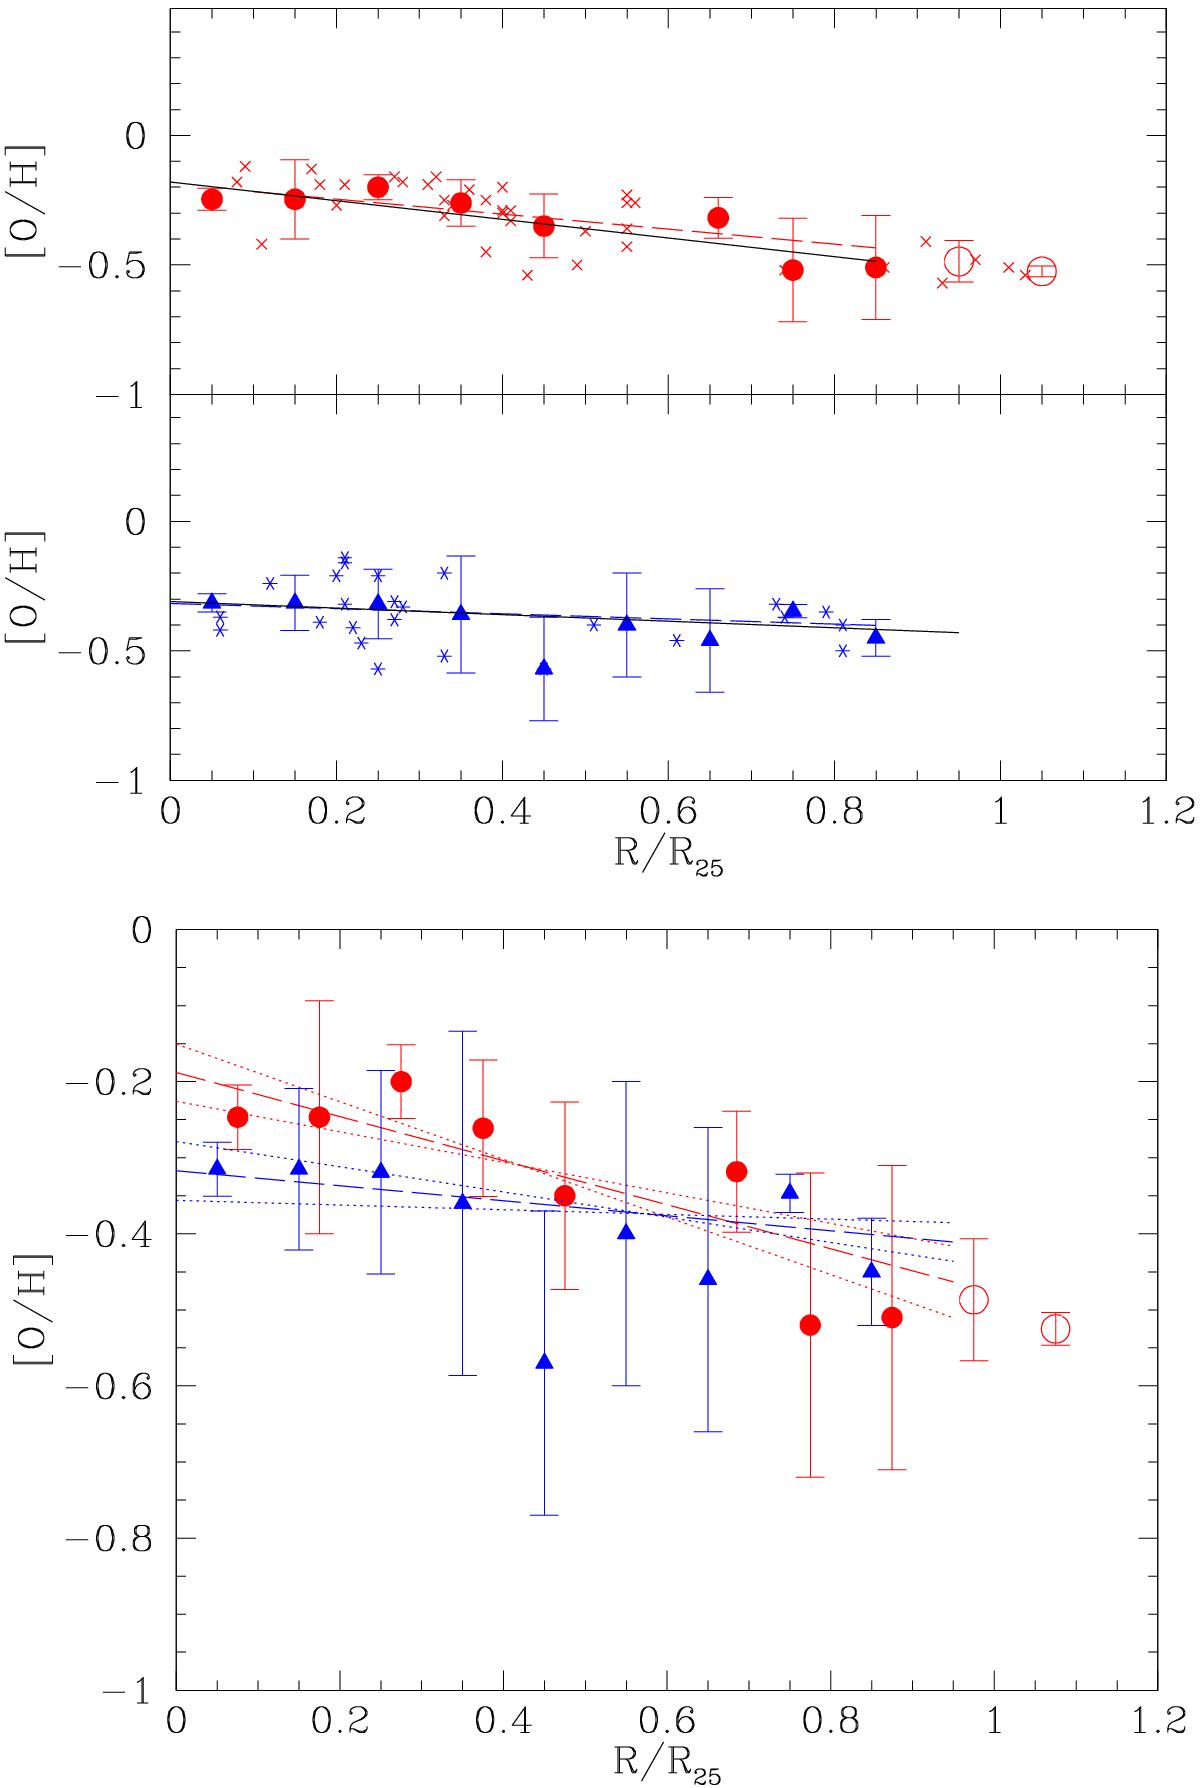
NGC 300. Upper panel: individual and binned results for H ii regions (red circles and crosses for binned and individual results, respectively) and PNe (blue triangles and crosses for binned and individual results, respectively) in NGC 300. The O abundances of PNe and H ii regions are from Stasińska et al. (2013) and Bresolin et al. (2009). The dashed black lines are the gradients of Stasińska et al. (2013). The continuous lines are weighted linear fits computed in the radial regions where both populations are available. The typical errors in O/H for each dataset are shown on the right side of each panel. Lower panel: weighted linear fits of PN and H ii regions binned metallicities as in the upper panel. Each point corresponds to the average metallicity of the PN or H ii region population in a radial bin of 0.1R/R25. Empty symbols are for radial positions outside R25 or for populations that have no correspondence in the other sample (excluded from the fits). Dotted lines indicate the errors on the slopes and intercepts.
Current usage metrics show cumulative count of Article Views (full-text article views including HTML views, PDF and ePub downloads, according to the available data) and Abstracts Views on Vision4Press platform.
Data correspond to usage on the plateform after 2015. The current usage metrics is available 48-96 hours after online publication and is updated daily on week days.
Initial download of the metrics may take a while.